Reading List
The most recent articles from a list of feeds I subscribe to.
How do Nix builds work?
Hello! For some reason after the last nix post I got nerdsniped by trying to understand how Nix builds work under the hood, so here’s a quick exploration I did today. There are probably some mistakes in here.
I started by complaining on Mastodon:
are there any guides to nix that start from the bottom up (for example starting with this bash script and then working up the layers of abstraction) instead of from the top down?
all of the guides I’ve seen start by describing the nix programming language or other abstractions, and I’d love to see a guide that starts with concepts I already understand like compiler flags, linker flags, Makefiles, environment variables, and bash scripts
Ross Light wrote a great blog post in response called Connecting Bash to Nix, that shows how to compile a basic C program without using most of Nix’s standard machinery.
I wanted to take this a tiny bit further and compile a slightly more complicated C program.
the goal: compile a C program, without using Nix’s standard machinery
Our goal is to compile a C program called paperjam. This is a real C program
that wasn’t in the Nix repository already. I already figured out how to
compile it in this post by copying and pasting a bunch of stuff I didn’t understand, but this time I wanted to do
it in a more principled way where I actually understand more of the steps.
We’re going to avoid using most of Nix’s helpers for compiling C programs.
The plan is to start with an almost empty build script, and then resolve errors until we have a working build.
first: what’s a derivation?
I said that we weren’t going to talk about too many Nix abstractions (and we won’t!), but understanding what a derivation is really helped me.
Everything I read about Nix talks about derivations all the time, but I was
really struggling to figure out what a derivation is. It turns out that derivation
is a function in the Nix language. But not just any function! The whole point of the Nix language seems to be to
to call this function. The official documentation for the derivation function is actually extremely clear. Here’s what I took away:
derivation takes a bunch of keys and values as input. There are 3 required keys:
system: the system, for examplex86_64-darwinname: the name of the package you’re buildingbuilder: a program (usually a bash script) that runs the build
Every other key is an arbitrary string that gets passed as an environment
variable to the builder shell script.
derivations automatically build all their inputs
A derivation doesn’t just call a shell script though! Let’s say I reference another derivation called pkgs.qpdf in my script.
Nix will:
- automatically build the
qpdfpackage - put the resulting output directory somewhere like
/nix/store/4garxzr1rpdfahf374i9p9fbxnx56519-qpdf-11.1.0 - expand
pkgs.qpdfinto that output directory (as a string), so that I can reference it in my build script
The derivation function does some other things (described in the documentation), but “it builds all of its inputs” is all we really need to know for now.
step 1: write a derivation file
Let’s write a very simple build script and call the derivation function. These don’t work yet,
but I found it pretty fun to go through all the errors, fix them one at a time,
and learn a little more about how Nix works by fixing them.
Here’s the build script (build_paperjam.sh). This just unpacks the tarball and runs make install.
#!/bin/bash

tar -xf "$SOURCE"
cd paperjam-1.2
make install
And here’s the Nix code calling the derivation function (in paperjam.nix). This calls the core derivation function, without too much magic.
let pkgs = import (fetchTarball "https://github.com/NixOS/nixpkgs/archive/4d2b37a84fad1091b9de401eb450aae66f1a741e.tar.gz") {};

builtins.derivation {
  name = "paperjam-fake";
  builder = ./build-paperjam.sh;
  system = builtins.currentSystem;

  SOURCE = pkgs.fetchurl {
    url = "https://mj.ucw.cz/download/linux/paperjam-1.2.tar.gz";
    hash = "sha256-0AziT7ROICTEPKaA4Ub1B8NtIfLmxRXriW7coRxDpQ0";
  };

}
The main things here are:
fetchurl(which downloads an url and puts the path in to theSOURCEenvironment variable)pkgs(which lets us depend on other Nix packages from the central repository). I don’t totally understand this but I’m already in a pretty deep rabbit hole so we’re going to leave that for now.
SOURCE evaluates to a string – it’s the path to the downloaded source tarball.
problem 1: tar: command not found
Nix needs you to declare all the dependencies for your builds. It forces this
by removing your PATH environment variable so that you have no binaries in
your PATH at all.
This is pretty easy to fix: we just need to edit our PATH.
I added this to paperjam.nix to get tar, gzip, and make:
PATH = "${pkgs.gzip}/bin:${pkgs.gnutar}/bin:${pkgs.gnumake}/bin";
problem 2: we need a compiler
Next, we had this error:
g++ -O2 -Wall -Wextra -Wno-parentheses -std=gnu++11 -g -DVERSION='"1.2"' -DYEAR='"2022"' -DBUILD_DATE='""' -DBUILD_COMMIT='""'   -c -o paperjam.o paperjam.cc
make: g++: No such file or directory
So we need to put a compiler in our PATH. For some reason I felt like using clang++ to compile, not g++. To do that I need to make 2 changes to paperjam.nix:
- Add the line
CXX="clang++"; - Add
${pkgs.clang}/binto myPATH
problem 3: missing header files
The next error was:
 > ./pdf-tools.h:13:10: fatal error: 'qpdf/QPDF.hh' file not found
 > #include <qpdf/QPDF.hh>
Makes sense: everything is isolated, so it can’t access my system header files. Figuring out how to handle this was a little more confusing though.
It turns out that the way Nix handles header files is that it has a shell
script wrapper around clang. So when you run clang++, you’re actually
running a shell script.
On my system, the clang++ wrapper script was at /nix/store/d929v59l9a3iakvjccqpfqckqa0vflyc-clang-wrapper-11.1.0/bin/clang++. I searched that file for LDFLAGS and found that it uses 2 environment variables:
NIX_LDFLAGS_aarch64_apple_darwinNIX_CFLAGS_COMPILE_aarch64_apple_darwin
So I figured I needed to put all the arguments to clang in the NIX_CFLAGS variable and all the linker arguments in NIX_LDFLAGS. Great! Let’s do that.
I added these 2 lines to my paperjam.nix, to link the libpaper and qpdf libraries:
NIX_LDFLAGS_aarch64_apple_darwin = "-L ${pkgs.qpdf}/lib   -L ${pkgs.libpaper}/lib";
NIX_CFLAGS_COMPILE_aarch64_apple_darwin = "-isystem ${pkgs.qpdf}/include   -isystem ${pkgs.libpaper}/include";
And that worked!
problem 4: missing c++abi
The next error was:
> ld: library not found for -lc++abi
Not sure what this means, but I searched for “abi” in the Nix packages and fixed it by adding -L ${pkgs.libcxxabi}/lib to my NIX_LDFLAGS environment variable.
problem 5: missing iconv
Here’s the next error:
> Undefined symbols for architecture arm64:
>   "_iconv", referenced from: ...
I started by adding -L ${pkgs.libiconv}/lib to my NIX_LDFLAGS environment variable, but that didn’t fix it. Then I spent a while going around in circles and being confused.
I eventually figured out how to fix this by taking a working version of the paperjam build that I’d made before
and editing my clang++ wrapper file to print out all of its environment
variables. The LDFLAGS environment variable in the working version was different from mine: it had -liconv in it.
So I added -liconv to NIX_LDFLAGS as well and that fixed it.
why doesn’t the original Makefile have -liconv?
I was a bit puzzled by this -liconv thing though: the original Makefile links
in libqpdf and libpaper by passing -lqpdf -lpaper. So why doesn’t it link in iconv, if it requires the
iconv library?
I think the reason for this is that the original Makefile assumed that you were
running on Linux and using glibc, and glibc includes these iconv functions by
default. But I guess Mac OS libc doesn’t include iconv, so we need to
explicitly set the linker flag -liconv to add the iconv library.
problem 6: missing codesign_allocate
Time for the next error:
libc++abi: terminating with uncaught exception of type std::runtime_error: Failed to spawn codesign_allocate: No such file or directory
I guess this is some kind of Mac code signing thing. I used find /nix/store -name codesign_allocate to find codesign_allocate on my system. It’s at
/nix/store/a17dwfwqj5ry734zfv3k1f5n37s4wxns-cctools-binutils-darwin-973.0.1/bin/codesign_allocate.
But this doesn’t tell us what the package is called – we need to be able to refer to it as ${pkgs.XXXXXXX} and ${pkgs.cctools-binutils-darwin} doesn’t work.
I couldn’t figure out a way go from a Nix folder to the name of the package, but I ended up poking around and finding out that it was called pkgs.darwin.cctools.
So I added ${pkgs.darwin.cctools}/bin to the PATH.
problem 7: missing a2x
Easy, just add ${pkgs.asciidoc}/bin to the PATH.
problem 8: missing install
make: install: No such file or directory
Apparently install is a program? This turns out to be in coreutils, so we add ${pkgs.coreutils}/bin to the PATH. Adding coreutils also fixes some other warnings I was seeing about missing commands like date.
problem 9: can’t create /usr/local/bin/paperjam
This took me a little while to figure out because I’m not very familiar with make. The Makefile has a PREFIX of /usr/local, but we want it to be the program’s output directory in /nix/store/
I edited the build-paperjam.sh shell script to say:
make install PREFIX="$out"
and everything worked! Hooray!
our final configuration
Here’s the final paperjam.nix. It’s not so different from what we started with – we just added 4 environment variables.
let pkgs = import (fetchTarball "https://github.com/NixOS/nixpkgs/archive/ae8bdd2de4c23b239b5a771501641d2ef5e027d0.tar.gz") {};
in

builtins.derivation {
  name = "paperjam-fake";
  builder = ./build-paperjam.sh;
  system = builtins.currentSystem;

  SOURCE = pkgs.fetchurl {
    url = "https://mj.ucw.cz/download/linux/paperjam-1.2.tar.gz";
    hash = "sha256-0AziT7ROICTEPKaA4Ub1B8NtIfLmxRXriW7coRxDpQ0";
  };

  CXX="clang++";
  PATH = "${pkgs.gzip}/bin:${pkgs.gnutar}/bin:${pkgs.gnumake}/bin:${pkgs.clang}/bin:${pkgs.darwin.cctools}/bin:${pkgs.asciidoc}/bin:${pkgs.coreutils}/bin:${pkgs.bash}/bin";
  NIX_LDFLAGS_aarch64_apple_darwin = "-L ${pkgs.qpdf}/lib   -L ${pkgs.libpaper}/lib -L ${pkgs.libcxxabi}/lib -liconv -L ${pkgs.libiconv}/lib ";
  NIX_CFLAGS_COMPILE_aarch64_apple_darwin = "-isystem ${pkgs.qpdf}/include   -isystem ${pkgs.libpaper}/include";
}
And here’s the final build-paperjam.sh build script. Here we just needed to edit the make install line to set the PREFIX.
#!/bin/bash

tar -xf "$SOURCE"
cd paperjam-1.2
make install PREFIX="$out"
let’s look at our compiled derivation!
Now that we understand this configuration a little better, let’s talk about
what nix-build is doing a little more.
Behind the scenes, nix-build paperjam.nix actually runs nix-instantiate and nix-store --realize:
$ nix-instantiate paperjam.nix
/nix/store/xp8kibpll55s0bm40wlpip51y7wnpfs0-paperjam-fake.drv
$ nix-store --realize /nix/store/xp8kibpll55s0bm40wlpip51y7wnpfs0-paperjam-fake.drv
I think what this means is that paperjam.nix get compiled to some
intermediate representation (also called a derivation?), and then the Nix
runtime takes over and is in charge of actually running the build scripts.
We can look at this .drv intermediate representation with nix show-derivation
{
  "/nix/store/xp8kibpll55s0bm40wlpip51y7wnpfs0-paperjam-fake.drv": {
    "outputs": { "out": { "path": "/nix/store/bcnyqizvcysqc1vy382wfx015mmwn3bd-paperjam-fake" }
    },
    "inputSrcs": [ "/nix/store/pbjj91f0qr8g14k58m744wdl9yvr2f5k-build-paperjam.sh" ],
    "inputDrvs": {
      "/nix/store/38sikqcggyishxbgi2xnyrdsnq928gqx-asciidoc-10.2.0.drv": [ "out" ],
      "/nix/store/3llc749f9pn0amlb9vgwsi22hin7kmz4-libcxxabi-11.1.0.drv": [ "out" ],
      "/nix/store/a8ny8lrbpyn15wdxk3v89f4bdr08a38a-libpaper-1.1.28.drv": [ "out" ],
      "/nix/store/d888pj9lll12s5qx11v850g1vd4h3vxq-cctools-port-973.0.1.drv": [ "out" ],
      "/nix/store/gkpdv7xl39x9yxch0wjarq19mmv7j1pm-bash-5.2-p15.drv": [ "out" ],
      "/nix/store/hwx16m7hmkp2rcik8h67nnyjp52zj849-gnutar-1.34.drv": [ "out" ],
      "/nix/store/kqqwffajj24fmagxqps3bjcbrglbdryg-gzip-1.12.drv": [ "out" ],
      "/nix/store/lnrxa45bza18dk8qgqjayqb65ilfvq2n-qpdf-11.2.0.drv": [ "out" ],
      "/nix/store/rx7a5401h44dqsasl5g80fl25jqqih8r-gnumake-4.4.drv": [ "out" ],
      "/nix/store/sx8blaza5822y51abdp3353xkdcbkpkb-coreutils-9.1.drv": [ "out" ],
      "/nix/store/v3b7r7a8ipbyg9wifcqisf5vpy0c66cs-clang-wrapper-11.1.0.drv": [ "out" ],
      "/nix/store/wglagz34w1jnhr4xrfdk0g2jghbk104z-paperjam-1.2.tar.gz.drv": [ "out" ],
      "/nix/store/y9mb7lgqiy38fbi53m5564bx8pl1arkj-libiconv-50.drv": [ "out" ]
    },
    "system": "aarch64-darwin",
    "builder": "/nix/store/pbjj91f0qr8g14k58m744wdl9yvr2f5k-build-paperjam.sh",
    "args": [],
    "env": {
      "CXX": "clang++",
      "NIX_CFLAGS_COMPILE_aarch64_apple_darwin": "-isystem /nix/store/h25d99pd3zln95viaybdfynfq82r2dqy-qpdf-11.2.0/include   -isystem /nix/store/agxp1hx267qk1x79dl4jk1l5cg79izv1-libpaper-1.1.28/include",
      "NIX_LDFLAGS_aarch64_apple_darwin": "-L /nix/store/h25d99pd3zln95viaybdfynfq82r2dqy-qpdf-11.2.0/lib   -L /nix/store/agxp1hx267qk1x79dl4jk1l5cg79izv1-libpaper-1.1.28/lib -L /nix/store/awkb9g93ci2qy8yg5jl0zxw46f3xnvgv-libcxxabi-11.1.0/lib -liconv -L /nix/store/nmphpbjn8hhq7brwi9bw41m7l05i636h-libiconv-50/lib ",
      "PATH": "/nix/store/90cqrp3nxbcihkx4vswj5wh85x5klaga-gzip-1.12/bin:/nix/store/siv9312sgiqwsjrdvj8lx0mr3dsj3nf5-gnutar-1.34/bin:/nix/store/yy3fdgrshcblwx0cfp76nmmi24szw89q-gnumake-4.4/bin:/nix/store/cqag9fv2gia03nzcsaygan8fw1ggdf4g-clang-wrapper-11.1.0/bin:/nix/store/f16id36r9xxi50mgra55p7cf7ra0x96k-cctools-port-973.0.1/bin:/nix/store/x873pgpwqxkmyn35jvvfj48ccqav7fip-asciidoc-10.2.0/bin:/nix/store/vhivi799z583h2kf1b8lrr72h4h3vfcx-coreutils-9.1/bin:/nix/store/0q1jfjlwr4vig9cz7lnb5il9rg0y1n84-bash-5.2-p15/bin",
      "SOURCE": "/nix/store/6d2fcw88d9by4fz5xa9gdpbln73dlhdk-paperjam-1.2.tar.gz",
      "builder": "/nix/store/pbjj91f0qr8g14k58m744wdl9yvr2f5k-build-paperjam.sh",
      "name": "paperjam-fake",
      "out": "/nix/store/bcnyqizvcysqc1vy382wfx015mmwn3bd-paperjam-fake",
      "system": "aarch64-darwin"
    }
  }
}
This feels surprisingly easy to understand – you can see that there are a bunch of environment variables, our bash script, and the paths to our inputs.
the compilation helpers we’re not using: stdenv
Normally when you build a package with Nix, you don’t do all of this stuff
yourself. Instead, you use a helper called stdenv, which seems to have two parts:
- a function called
stdenv.mkDerivationwhich takes some arguments and generates a bunch of environment variables (it seems to be documented here) - a 1600-line bash build script (setup.sh) that consumes those environment variables. This is like our
build-paperjam.sh, but much more generalized.
Together, these two tools:
- add
LDFLAGSautomatically for each C library you depend on - add
CFLAGSautomatically so that you can get your header files - run
make - depend on clang and coreutils and bash and other core utilities so that you don’t need to add them yourself
- set
systemto your current system - let you easily add custom bash code to run at various phases of your build
- maybe also manage versions somehow? Not sure about this one.
and probably lots more useful things I don’t know about yet
let’s look at the derivation for jq
Let’s look at one more compiled derivation, for jq. This is quite long but there
are some interesting things in here. I wanted to look at this because I wanted to see what a more typical derivation generated by stdenv.mkDerivation looked like.
$ nix show-derivation /nix/store/q9cw5rp0ibpl6h4i2qaq0vdjn4pyms3p-jq-1.6.drv
{
  "/nix/store/q9cw5rp0ibpl6h4i2qaq0vdjn4pyms3p-jq-1.6.drv": {
    "outputs": {
      "bin": { "path": "/nix/store/vabn35a2m2qmfi9cbym4z50bwq94fdzm-jq-1.6-bin" },
      "dev": { "path": "/nix/store/akda158i8gr0v0w397lwanxns8yrqldy-jq-1.6-dev" },
      "doc": { "path": "/nix/store/6qimafz8q88l90jwrzciwc27zhjwawcl-jq-1.6-doc" },
      "lib": { "path": "/nix/store/3wzlsin34l1cs70ljdy69q9296jnvnas-jq-1.6-lib" },
      "man": { "path": "/nix/store/dl1xf9w928jai5hvm5s9ds35l0m26m0k-jq-1.6-man" },
      "out": { "path": "/nix/store/ivzm5rrr7riwvgy2xcjhss6lz55qylnb-jq-1.6" }
    },
    "inputSrcs": [
      "/nix/store/6xg259477c90a229xwmb53pdfkn6ig3g-default-builder.sh",
      "/nix/store/jd98q1h1rxz5iqd5xs8k8gw9zw941lj6-fix-tests-when-building-without-regex-supports.patch"
    ],
    "inputDrvs": {
      "/nix/store/0lbzkxz56yhn4gv5z0sskzzdlwzkcff8-autoreconf-hook.drv": [ "out" ],
      "/nix/store/6wh5w7hkarfcx6fxsdclmlx097xsimmg-jq-1.6.tar.gz.drv": [ "out" ],
      "/nix/store/87a32xgqw85rxr1fx3c5j86y177hr9sr-oniguruma-6.9.8.drv": [ "dev" ],
      "/nix/store/gkpdv7xl39x9yxch0wjarq19mmv7j1pm-bash-5.2-p15.drv": [ "out" ],
      "/nix/store/xn1mjk78ly9wia23yvnsyw35q1mz4jqh-stdenv-darwin.drv": [ "out" ]
    },
    "system": "aarch64-darwin",
    "builder": "/nix/store/0q1jfjlwr4vig9cz7lnb5il9rg0y1n84-bash-5.2-p15/bin/bash",
    "args": [
      "-e",
      "/nix/store/6xg259477c90a229xwmb53pdfkn6ig3g-default-builder.sh"
    ],
    "env": {
      "__darwinAllowLocalNetworking": "",
      "__impureHostDeps": "/bin/sh /usr/lib/libSystem.B.dylib /usr/lib/system/libunc.dylib /dev/zero /dev/random /dev/urandom /bin/sh",
      "__propagatedImpureHostDeps": "",
      "__propagatedSandboxProfile": "",
      "__sandboxProfile": "",
      "__structuredAttrs": "",
      "bin": "/nix/store/vabn35a2m2qmfi9cbym4z50bwq94fdzm-jq-1.6-bin",
      "buildInputs": "/nix/store/xfnl6xqbvnpacx8hw9d99ca4mly9kp0h-oniguruma-6.9.8-dev",
      "builder": "/nix/store/0q1jfjlwr4vig9cz7lnb5il9rg0y1n84-bash-5.2-p15/bin/bash",
      "cmakeFlags": "",
      "configureFlags": "--bindir=${bin}/bin --sbindir=${bin}/bin --datadir=${doc}/share --mandir=${man}/share/man",
      "depsBuildBuild": "",
      "depsBuildBuildPropagated": "",
      "depsBuildTarget": "",
      "depsBuildTargetPropagated": "",
      "depsHostHost": "",
      "depsHostHostPropagated": "",
      "depsTargetTarget": "",
      "depsTargetTargetPropagated": "",
      "dev": "/nix/store/akda158i8gr0v0w397lwanxns8yrqldy-jq-1.6-dev",
      "doCheck": "",
      "doInstallCheck": "1",
      "doc": "/nix/store/6qimafz8q88l90jwrzciwc27zhjwawcl-jq-1.6-doc",
      "installCheckTarget": "check",
      "lib": "/nix/store/3wzlsin34l1cs70ljdy69q9296jnvnas-jq-1.6-lib",
      "man": "/nix/store/dl1xf9w928jai5hvm5s9ds35l0m26m0k-jq-1.6-man",
      "mesonFlags": "",
      "name": "jq-1.6",
      "nativeBuildInputs": "/nix/store/ni9k35b9llfc3hys8nv5qsipw8pfy1ln-autoreconf-hook",
      "out": "/nix/store/ivzm5rrr7riwvgy2xcjhss6lz55qylnb-jq-1.6",
      "outputs": "bin doc man dev lib out",
      "patches": "/nix/store/jd98q1h1rxz5iqd5xs8k8gw9zw941lj6-fix-tests-when-building-without-regex-supports.patch",
      "pname": "jq",
      "postInstallCheck": "$bin/bin/jq --help >/dev/null\n$bin/bin/jq -r '.values[1]' <<< '{\"values\":[\"hello\",\"world\"]}' | grep '^world$' > /dev/null\n",
      "preBuild": "rm -r ./modules/oniguruma\n",
      "preConfigure": "echo \"#!/bin/sh\" > scripts/version\necho \"echo 1.6\" >> scripts/version\npatchShebangs scripts/version\n",
      "propagatedBuildInputs": "",
      "propagatedNativeBuildInputs": "",
      "src": "/nix/store/ggjlgjx2fw29lngbnvwaqr6hiz1qhy8g-jq-1.6.tar.gz",
      "stdenv": "/nix/store/qrz2mnb2gsnzmw2pqax693daxh5hsgap-stdenv-darwin",
      "strictDeps": "",
      "system": "aarch64-darwin",
      "version": "1.6"
    }
  }
}
I thought it was interesting that some of the environment variables in here are actually bash scripts themselves – for example the postInstallCheck environment variable is a bash script.
Those bash script environment variables are evaled in the main bash script (you can see that happening in setup.sh here)
The postInstallCheck environment variable in this particular derivation starts like this:
$bin/bin/jq --help >/dev/null
$bin/bin/jq -r '.values[1]' <<< '{"values":["hello","world"]}' | grep '^world$' > /dev/null
I guess this is a test to make sure that jq installed correctly.
finally: clean up
All of my compiler experiments used about 3GB of disk space, but nix-collect-garbage cleaned up all of it.
let’s recap the process!
I feel like I understand Nix a bit better after going through this. I still don’t feel very motivated to learn the Nix language, but now I have some idea of what Nix programs are actually doing under the hood!
My understanding is:
- First,
.nixfiles get compiled into a.drvfile, which is mostly a bunch of inputs and outputs and environment variables. This is where the Nix language stops being relevant. - Then all the environment variables get passed to a build script, which is in charge of doing the actual build
- In the Nix standard environment (
stdenv), some of those environment variables are themselves bash code, which getsevaled by the big build scriptsetup.sh
That’s all! I probably made some mistakes in here, but this was kind of a fun rabbit hole.
Some notes on using nix
Recently I started using a Mac for the first time. The biggest downside I’ve noticed so far is that the package management is much worse than on Linux. At some point I got frustrated with homebrew because I felt like it was spending too much time upgrading when I installed new packages, and so I thought – maybe I’ll try the nix package manager!
nix has a reputation for being confusing (it has its whole own programming language!), so I’ve been trying to figure out how to use nix in a way that’s as simple as possible and does not involve managing any configuration files or learning a new programming language. Here’s what I’ve figured out so far! We’ll talk about how to:
- install packages with nix
- build a custom nix package for a C++ program called paperjam
- install a 5-year-old version of hugo with nix
As usual I’ve probably gotten some stuff wrong in this post since I’m still pretty new to nix. I’m also still not sure how much I like nix – it’s very confusing! But it’s helped me compile some software that I was struggling to compile otherwise, and in general it seems to install things faster than homebrew.
what’s interesting about nix?
People often describe nix as “declarative package management”. I don’t care that much about declarative package management, so here are two things that I appreciate about nix:
- It provides binary packages (hosted at https://cache.nixos.org/) that you can quickly download and install
- For packages which don’t have binary packages, it makes it easier to compile them
I think that the reason nix is good at compiling software is that:
- you can have multiple versions of the same library or program installed at a time (you could have 2 different versions of libc for instance). For example I have two versions of node on my computer right now, one at
/nix/store/4ykq0lpvmskdlhrvz1j3kwslgc6c7pnv-nodejs-16.17.1and one at/nix/store/5y4bd2r99zhdbir95w5pf51bwfg37bwa-nodejs-18.9.1. - when nix builds a package, it builds it in isolation, using only the
specific versions of its dependencies that you explicitly declared. So
there’s no risk that the package secretly depends on another package on your
system that you don’t know about. No more fighting with
LD_LIBRARY_PATH! - a lot of people have put a lot of work into writing down all of the dependencies of packages
I’ll give a couple of examples later in this post of two times nix made it easier for me to compile software.
how I got started with nix
here’s how I got started with nix:
- Install nix. I forget exactly how I did this, but it looks like there’s an official installer and an unofficial installer from zero-to-nix.com. The instructions for uninstalling nix on MacOS with the standard multi-user install are a bit complicated, so it might be worth choosing an installation method with simpler uninstall instructions.
- Put
~/.nix-profile/binon my PATH - Install packages with
nix-env -iA nixpkgs.NAME - That’s it.
Basically the idea is to treat nix-env -iA like brew install or apt-get install.
For example, if I want to install fish, I can do that like this:
nix-env -iA nixpkgs.fish
This seems to just download some binaries from https://cache.nixos.org – pretty simple.
Some people use nix to install their Node and Python and Ruby packages, but I haven’t
been doing that – I just use npm install and pip install the same way I
always have.
some nix features I’m not using
There are a bunch of nix features/tools that I’m not using, but that I’ll mention. I originally thought that you had to use these features to use nix, because most of the nix tutorials I’ve read talk about them. But you don’t have to use them.
- NixOS (a Linux distribution)
- nix-shell
- nix flakes
- home-manager
- devenv.sh
I won’t go into these because I haven’t really used them and there are lots of explanations out there.
where are nix packages defined?
I think packages in the main nix package repository are defined in https://github.com/NixOS/nixpkgs/
It looks like you can search for packages at https://search.nixos.org/packages. The two official ways to search packages seem to be:
nix-env -qaP NAME, which is very extremely slow and which I haven’t been able to get to actually worknix --extra-experimental-features 'nix-command flakes' search nixpkgs NAME, which does seem to work but is kind of a mouthful. Also all of the packages it prints out start withlegacyPackagesfor some reason
I found a way to search nix packages from the command line that I liked better:
- Run
nix-env -qa '*' > nix-packages.txtto get a list of every package in the Nix repository - Write a short
nix-searchscript that just grepspackages.txt(cat ~/bin/nix-packages.txt | awk '{print $1}' | rg "$1")
everything is installed with symlinks
One of nix’s major design choices is that there isn’t one single bin with all
your packages, instead you use symlinks. There are a lot of layers of symlinks. A few examples of symlinks:
~/.nix-profileon my machine is (indirectly) a symlink to/nix/var/nix/profiles/per-user/bork/profile-111-link/~/.nix-profile/bin/fishis a symlink to/nix/store/afkwn6k8p8g97jiqgx9nd26503s35mgi-fish-3.5.1/bin/fish
When I install something, it creates a new profile-112-link directory with new symlinks and updates my ~/.nix-profile to point to that directory.
I think this means that if I install a new version of fish and I don’t like it, I can
easily go back just by running nix-env --rollback – it’ll move me to my previous profile directory.
uninstalling packages doesn’t delete them
If I uninstall a nix package like this, it doesn’t actually free any hard drive space, it just removes the symlinks.
$ nix-env --uninstall oil
I’m still not sure how to actually delete the package – I ran a garbage collection like this, which seemed to delete some things:
$ nix-collect-garbage
...
85 store paths deleted, 74.90 MiB freed
But I still have oil on my system at /nix/store/8pjnk6jr54z77jiq5g2dbx8887dnxbda-oil-0.14.0.
There’s a more aggressive version of nix-collect-garbage that also deletes old versions of your profiles (so that you can’t rollback)
$ nix-collect-garbage -d --delete-old
That doesn’t delete /nix/store/8pjnk6jr54z77jiq5g2dbx8887dnxbda-oil-0.14.0 either though and I’m not sure why.
upgrading
It looks like you can upgrade nix packages like this:
nix-channel --update
nix-env --upgrade
(similar to apt-get update && apt-get upgrade)
I haven’t really upgraded anything yet. I think that if something goes wrong with an upgrade, you can roll back (because everything is immutable in nix!) with
nix-env --rollback
Someone linked me to this post from Ian Henry that
talks about some confusing problems with nix-env --upgrade – maybe it
doesn’t work the way you’d expect? I guess I’ll be wary around upgrades.
next goal: make a custom package of paperjam
After a few months of installing existing packages, I wanted to make a custom package with nix for a program called paperjam that wasn’t already packaged.
I was actually struggling to compile paperjam at all even without nix because the version I had
of libiconv I has on my system was wrong. I thought it might be easier to
compile it with nix even though I didn’t know how to make nix packages yet. And
it actually was!
But figuring out how to get there was VERY confusing, so here are some notes about how I did it.
how to build an example package
Before I started working on my paperjam package, I wanted to build an example existing package just to
make sure I understood the process for building a package. I was really
struggling to figure out how to do this, but I asked in Discord and someone
explained to me how I could get a working package from https://github.com/NixOS/nixpkgs/ and build it. So here
are those instructions:
step 1: Download some arbitrary package from nixpkgs on github, for example the dash package:
wget https://raw.githubusercontent.com/NixOS/nixpkgs/47993510dcb7713a29591517cb6ce682cc40f0ca/pkgs/shells/dash/default.nix -O dash.nix
step 2: Replace the first statement ({ lib , stdenv , buildPackages , autoreconfHook , pkg-config , fetchurl , fetchpatch , libedit , runCommand , dash }: with with import <nixpkgs> {}; I don’t know why you have to do this,
but it works.
step 3: Run nix-build dash.nix
This compiles the package
step 4: Run nix-env -i -f dash.nix
This installs the package into my ~/.nix-profile
That’s all! Once I’d done that, I felt like I could modify the dash package and make my own package.
how I made my own package
paperjam has one dependency (libpaper) that also isn’t packaged yet, so I needed to build libpaper first.
Here’s libpaper.nix. I basically just wrote this by copying and pasting from
other packages in the nixpkgs repository.
My guess is what’s happening here is that nix has some default rules for
compiling C packages (like “run make install”), so the make install happens
default and I don’t need to configure it explicitly.
with import <nixpkgs> {};

stdenv.mkDerivation rec {
  pname = "libpaper";
  version = "0.1";

  src = fetchFromGitHub {
    owner = "naota";
    repo = "libpaper";
    rev = "51ca11ec543f2828672d15e4e77b92619b497ccd";
    hash = "sha256-S1pzVQ/ceNsx0vGmzdDWw2TjPVLiRgzR4edFblWsekY=";
  };

  buildInputs = [ ];

  meta = with lib; {
    homepage = "https://github.com/naota/libpaper";
    description = "libpaper";
    platforms = platforms.unix;
    license = with licenses; [ bsd3 gpl2 ];
  };
}
Basically this just tells nix how to download the source from GitHub.
I built this by running nix-build libpaper.nix
Next, I needed to compile paperjam. Here’s a link to the nix package I wrote. The main things I needed to do other than telling it where to download the source were:
- add some extra build dependencies (like
asciidoc) - set some environment variables for the install (
installFlags = [ "PREFIX=$(out)" ];) so that it installed in the correct directory instead of/usr/local/bin.
I set the hashes by first leaving the hash empty, then running nix-build to get an error message complaining about a mismatched hash. Then I copied the correct hash out of the error message.
I figured out how to set installFlags just by running rg PREFIX
in the nixpkgs repository – I figured that needing to set a PREFIX was
pretty common and someone had probably done it before, and I was right. So I
just copied and pasted that line from another package.
Then I ran:
nix-build paperjam.nix
nix-env -i -f paperjam.nix
and then everything worked and I had paperjam installed! Hooray!
next goal: install a 5-year-old version of hugo
Right now I build this blog using Hugo 0.40, from 2018. I don’t need any new features so I haven’t felt a need to upgrade. On Linux this is easy: Hugo’s releases are a static binary, so I can just download the 5-year-old binary from the releases page and run it. Easy!
But on this Mac I ran into some complications. Mac hardware has changed in the
last 5 years, so the Mac Hugo binary I downloaded crashed. And when I tried to
build it from source with go build, that didn’t work either because Go build
norms have changed in the last 5 years as well.
I was working around this by running Hugo in a Linux docker container, but I didn’t love that: it was kind of slow and it felt silly. It shouldn’t be that hard to compile one Go program!
Nix to the rescue! Here’s what I did to install the old version of Hugo with nix.
installing Hugo 0.40 with nix
I wanted to install Hugo 0.40 and put it in my PATH as hugo-0.40. Here’s how
I did it. I did this in a kind of weird way, but it worked (Searching and installing old versions of Nix packages
describes a probably more normal method).
step 1: Search through the nixpkgs repo to find Hugo 0.40
I found the .nix file here https://github.com/NixOS/nixpkgs/blob/17b2ef2/pkgs/applications/misc/hugo/default.nix
step 2: Download that file and build it
I downloaded that file (and another file called deps.nix in the same directory), replaced the first line with with import <nixpkgs> {};, and built it with nix-build hugo.nix.
That almost worked without any changes, but I had to make two changes:
- replace
with stdenv.libtowith libfor some reason. - rename the package to
hugo040so that it wouldn’t conflict with the other version ofhugothat I had installed
step 3: Rename hugo to hugo-0.40
I write a little post install script to rename the Hugo binary.
  postInstall = ''
    mv $out/bin/hugo $out/bin/hugo-0.40
  '';
I figured out how to run this by running rg 'mv ' in the nixpkgs repository and just copying and modifying something that seemed related.
step 4: Install it
I installed into my ~/.nix-profile/bin by running nix-env -i -f hugo.nix.
And it all works! I put the final .nix file into my own personal nixpkgs repo so that I can use it again later if I
want.
reproducible builds aren’t magic, they’re really hard
I think it’s worth noting here that this hugo.nix file isn’t magic – the
reason I can easily compile Hugo 0.40 today is that many people worked for a long time to make it possible to
package that version of Hugo in a reproducible way.
that’s all!
Installing paperjam and this 5-year-old version of Hugo were both
surprisingly painless and actually much easier than compiling it without nix,
because nix made it much easier for me to compile the paperjam package with
the right version of libiconv, and because someone 5 years ago had already
gone to the trouble of listing out the exact dependencies for Hugo.
I don’t have any plans to get much more complicated with nix (and it’s still very possible I’ll get frustrated with it and go back to homebrew!), but we’ll see what happens! I’ve found it much easier to start in a simple way and then start using more features if I feel the need instead of adopting a whole bunch of complicated stuff all at once.
I probably won’t use nix on Linux – I’ve always been happy enough with apt
(on Debian-based distros) and pacman (on Arch-based distros), and they’re
much less confusing. But on a Mac it seems like it might be worth it. We’ll
see! It’s very possible in 3 months I’ll get frustrated with nix and just go back to homebrew.
5-month update: rebuilding my nix profile
Update from 5 months in: nix is still going well, and I’ve only run into 1
problem, which is that every nix-env -iA package installation started failing
with the error “bad meta.outputsToInstall”.
This script from Ross Light fixes that problem though. It lists every derivation installed in my current profile and creates a new profile with the exact same derivations. This feels like a nix bug (surely creating a new profile with the exact same derivations should be a no-op?) but I haven’t looked into it more yet.
Writing Javascript without a build system
Hello! I’ve been writing some Javascript this week, and as always when I start a new frontend project, I was faced with the question: should I use a build system?
I want to talk about what’s appealing to me about build systems, why I (usually) still don’t use them, and why I find it frustrating that some frontend Javascript libraries require that you use a build system.
I’m writing this because most of the writing I see about JS assumes that you’re using a build system, and it can be hard to navigate for folks like me who write very simple small Javascript projects that don’t require a build system.
what’s a build system?
The idea is that you have a bunch of Javascript or Typescript code, and you want to translate it into different Javascript code before you put it on your website.
Build systems can do lots of useful things, like:
- combining 100s of JS files into one big bundle (for efficiency reasons)
- translating Typescript into Javascript
- typechecking Typescript
- minification
- adding polyfills to support older browsers
- compiling JSX
- treeshaking (remove unused JS code to reduce file sizes)
- building CSS (like tailwind does)
- and probably lots of other important things
Because of this, if you’re building a complex frontend project today, probably you’re using a build system like webpack, rollup, esbuild, parcel, or vite.
Lots of those features are appealing to me, and I’ve used build systems in the past for some of these reasons: Mess With DNS uses esbuild to translate Typescript and combine lots of files into one big file, for example.
the goal: easily make changes to old tiny websites
I make a lot of small simple websites, I have approximately 0 maintenance energy for any of them, and I change them very infrequently.
My goal is that if I have a site that I made 3 or 5 years ago, I’d like to be able to, in 20 minutes:
- get the source from github on a new computer
- make some changes
- put it on the internet
But my experience with build systems (not just Javascript build systems!), is that if you have a 5-year-old site, often it’s a huge pain to get the site built again.
And because most of my websites are pretty small, the advantage of using a
build system is pretty small – I don’t really need Typescript or JSX. I can
just have one 400-line script.js file and call it a day.
example: trying to build the SQL playground
One of my sites (the sql playground) uses a build system (it’s using Vue). I last edited that project 2 years ago, on a different machine.
Let’s see if I can still easily build it today on my machine. To start out, we have to run npm install. Here’s the output I get.
$ npm install
[lots of output redacted]
npm ERR! code 1
npm ERR! path /Users/bork/work/sql-playground.wizardzines.com/node_modules/grpc
npm ERR! command failed
npm ERR! command sh /var/folders/3z/g3qrs9s96mg6r4dmzryjn3mm0000gn/T/install-b52c96ad.sh
npm ERR! CXX(target) Release/obj.target/grpc/deps/grpc/src/core/lib/surface/init.o
npm ERR!   CXX(target) Release/obj.target/grpc/deps/grpc/src/core/lib/avl/avl.o
npm ERR!   CXX(target) Release/obj.target/grpc/deps/grpc/src/core/lib/backoff/backoff.o
npm ERR!   CXX(target) Release/obj.target/grpc/deps/grpc/src/core/lib/channel/channel_args.o
npm ERR!   CXX(target) Release/obj.target/grpc/deps/grpc/src/core/lib/channel/channel_stack.o
npm ERR!   CXX(target) Release/obj.target/grpc/deps/grpc/src/core/lib/channel/channel_stack_builder.o
npm ERR!   CXX(target) Release/obj.target/grpc/deps/grpc/src/core/lib/channel/channel_trace.o
npm ERR!   CXX(target) Release/obj.target/grpc/deps/grpc/src/core/lib/channel/channelz.o
There’s some kind of error building grpc. No problem. I don’t
really need that dependency anyway, so I can just take 5 minutes to tear it out
and rebuild. Now I can npm install and everything works.
Now let’s try to build the project:
$ npm run build
  ?  Building for production...Error: error:0308010C:digital envelope routines::unsupported
    at new Hash (node:internal/crypto/hash:71:19)
    at Object.createHash (node:crypto:130:10)
    at module.exports (/Users/bork/work/sql-playground.wizardzines.com/node_modules/webpack/lib/util/createHash.js:135:53)
    at NormalModule._initBuildHash (/Users/bork/work/sql-playground.wizardzines.com/node_modules/webpack/lib/NormalModule.js:414:16)
    at handleParseError (/Users/bork/work/sql-playground.wizardzines.com/node_modules/webpack/lib/NormalModule.js:467:10)
    at /Users/bork/work/sql-playground.wizardzines.com/node_modules/webpack/lib/NormalModule.js:499:5
    at /Users/bork/work/sql-playground.wizardzines.com/node_modules/webpack/lib/NormalModule.js:356:12
    at /Users/bork/work/sql-playground.wizardzines.com/node_modules/loader-runner/lib/LoaderRunner.js:373:3
    at iterateNormalLoaders (/Users/bork/work/sql-playground.wizardzines.com/node_modules/loader-runner/lib/LoaderRunner.js:214:10)
    at iterateNormalLoaders (/Users/bork/work/sql-playground.wizardzines.com/node_modules/loader-runner/lib/LoaderRunner.js:221:10)
    at /Users/bork/work/sql-playground.wizardzines.com/node_modules/loader-runner/lib/LoaderRunner.js:236:3
    at runSyncOrAsync (/Users/bork/work/sql-playground.wizardzines.com/node_modules/loader-runner/lib/LoaderRunner.js:130:11)
    at iterateNormalLoaders (/Users/bork/work/sql-playground.wizardzines.com/node_modules/loader-runner/lib/LoaderRunner.js:232:2)
    at Array.<anonymous> (/Users/bork/work/sql-playground.wizardzines.com/node_modules/loader-runner/lib/LoaderRunner.js:205:4)
    at Storage.finished (/Users/bork/work/sql-playground.wizardzines.com/node_modules/enhanced-resolve/lib/CachedInputFileSystem.js:43:16)
    at /Users/bork/work/sql-playground.wizardzines.com/node_modules/enhanced-resolve/lib/CachedInputFileSystem.js:79:9
This stack overflow answer suggests running export NODE_OPTIONS=--openssl-legacy-provider to fix this error.
That works, and finally I can npm run build to build the project.
This isn’t really that bad (I only had to remove a dependency and pass a slightly mysterious node option!), but I would rather not be derailed by those build errors.
for me, a build system isn’t worth it for small projects
For me, a complicated Javascript build system just doesn’t seem worth it for small 500-line projects – it means giving up being able to easily update the project in the future in exchange for some pretty marginal benefits.
esbuild seems a little more stable
I want to give a quick shoutout to esbuild: I learned about esbuild in 2021 and used for a project, and so far it does seem a more reliable way to build JS projects.
I just tried to build an esbuild project that I last touched 8 months ago on
a new computer, and it worked. But I can’t say for sure if I’ll be able to
easily build that project in 2 years. Maybe it will, I hope so!
not using a build system is usually pretty easy
Here’s what the part of nginx playground code that imports all the libraries looks like:
<script src="js/vue.global.prod.js"></script>
<script src="codemirror-5.63.0/lib/codemirror.js"></script>
<script src="codemirror-5.63.0/mode/nginx/nginx.js"></script>
<script src="codemirror-5.63.0/mode/shell/shell.js"></script>
<script src="codemirror-5.63.0/mode/javascript/javascript.js"></script>
<link rel="stylesheet" href="codemirror-5.63.0/lib/codemirror.css">
<script src="script.js "></script>
This project is also using Vue, but it just uses a <script src to load Vue –
there’s no build process for the frontend.
a no-build-system template for using Vue
A couple of people asked how to get started writing Javascript without a build system. Of course you can write vanilla JS if you want, but my usual framework is Vue 3.
Here’s a tiny template I built for starting a Vue 3 project with no build system. It’s just 2 files and ~30 lines of HTML/JS.
some libraries require you to use a build system
This build system stuff is on my mind recently because I’m using CodeMirror 5 for a new project this week, and I saw there was a new version, CodeMirror 6.
So I thought – cool, maybe I should use CodeMirror 6 instead of CodeMirror 5. But – it seems like you can’t use CodeMirror 6 without a build system (according to the migration guide). So I’m going to stick with CodeMirror 5.
Similarly, you used to be able to just download Tailwind as a giant CSS file, but Tailwind 3 doesn’t seem to be available as a big CSS file at all anymore, you need to run Javascript to build it. So I’m going to keep using Tailwind 2 for now. (I know, I know, you’re not supposed to use the big CSS file, but it’s only 300KB gzipped and I really don’t want a build step)
(edit: it looks like Tailwind released a standalone CLI in 2021 which seems like a nice option)
I’m not totally sure why some libraries don’t provide a no-build-system version – maybe distributing a no-build-system version would add a lot of additional complexity to the library, and the maintainer doesn’t think it’s worth it. Or maybe the library’s design means that it’s not possible to distribute a no-build-system version for some reason.
I’d love more tips for no-build-system javascript
My main strategies so far are:
- search for “CDN” on a library’s website to find a standalone javascript file
- use https://unpkg.com to see if the library has a built version I can use
- host my own version of libraries instead of relying on a CDN that might go down
- write my own simple integrations instead of pulling in another dependency (for example I wrote my own CodeMirror component for Vue the other day)
- if I want a build system, use esbuild
A couple of other things that look interesting but that I haven’t looked into:
- this typescript proposal for type syntax in Javascript comments
- ES modules generally
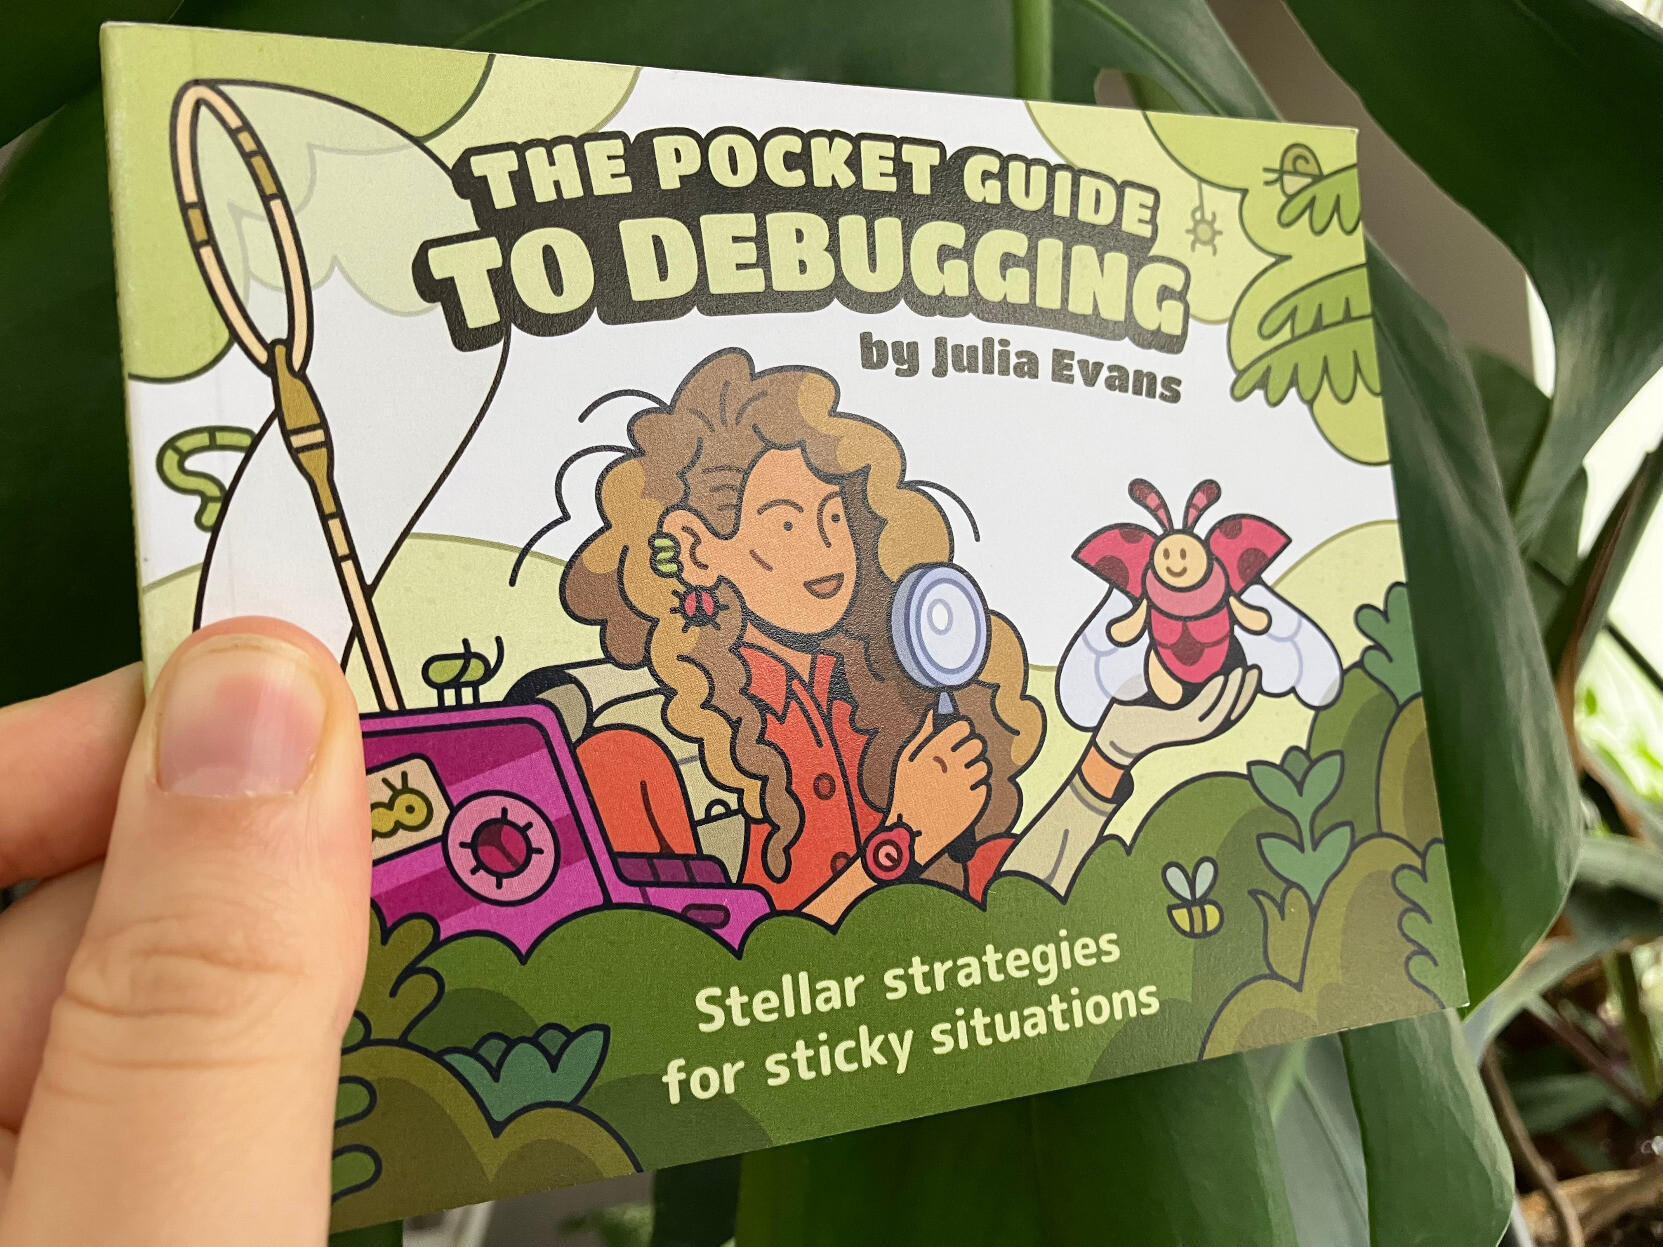
Print copies of The Pocket Guide to Debugging have arrived
Hello! We released The Pocket Guide to Debugging back in December, and here’s a final update: the print copies are done printing and they’ve arrived at the warehouse, ready to ship to anyone who wants one.
You can buy the print or PDF version now, and if you preordered it, your copy should already have shipped. Some people have told me that they already received theirs! Email me if you haven’t gotten the shipping confirmation.
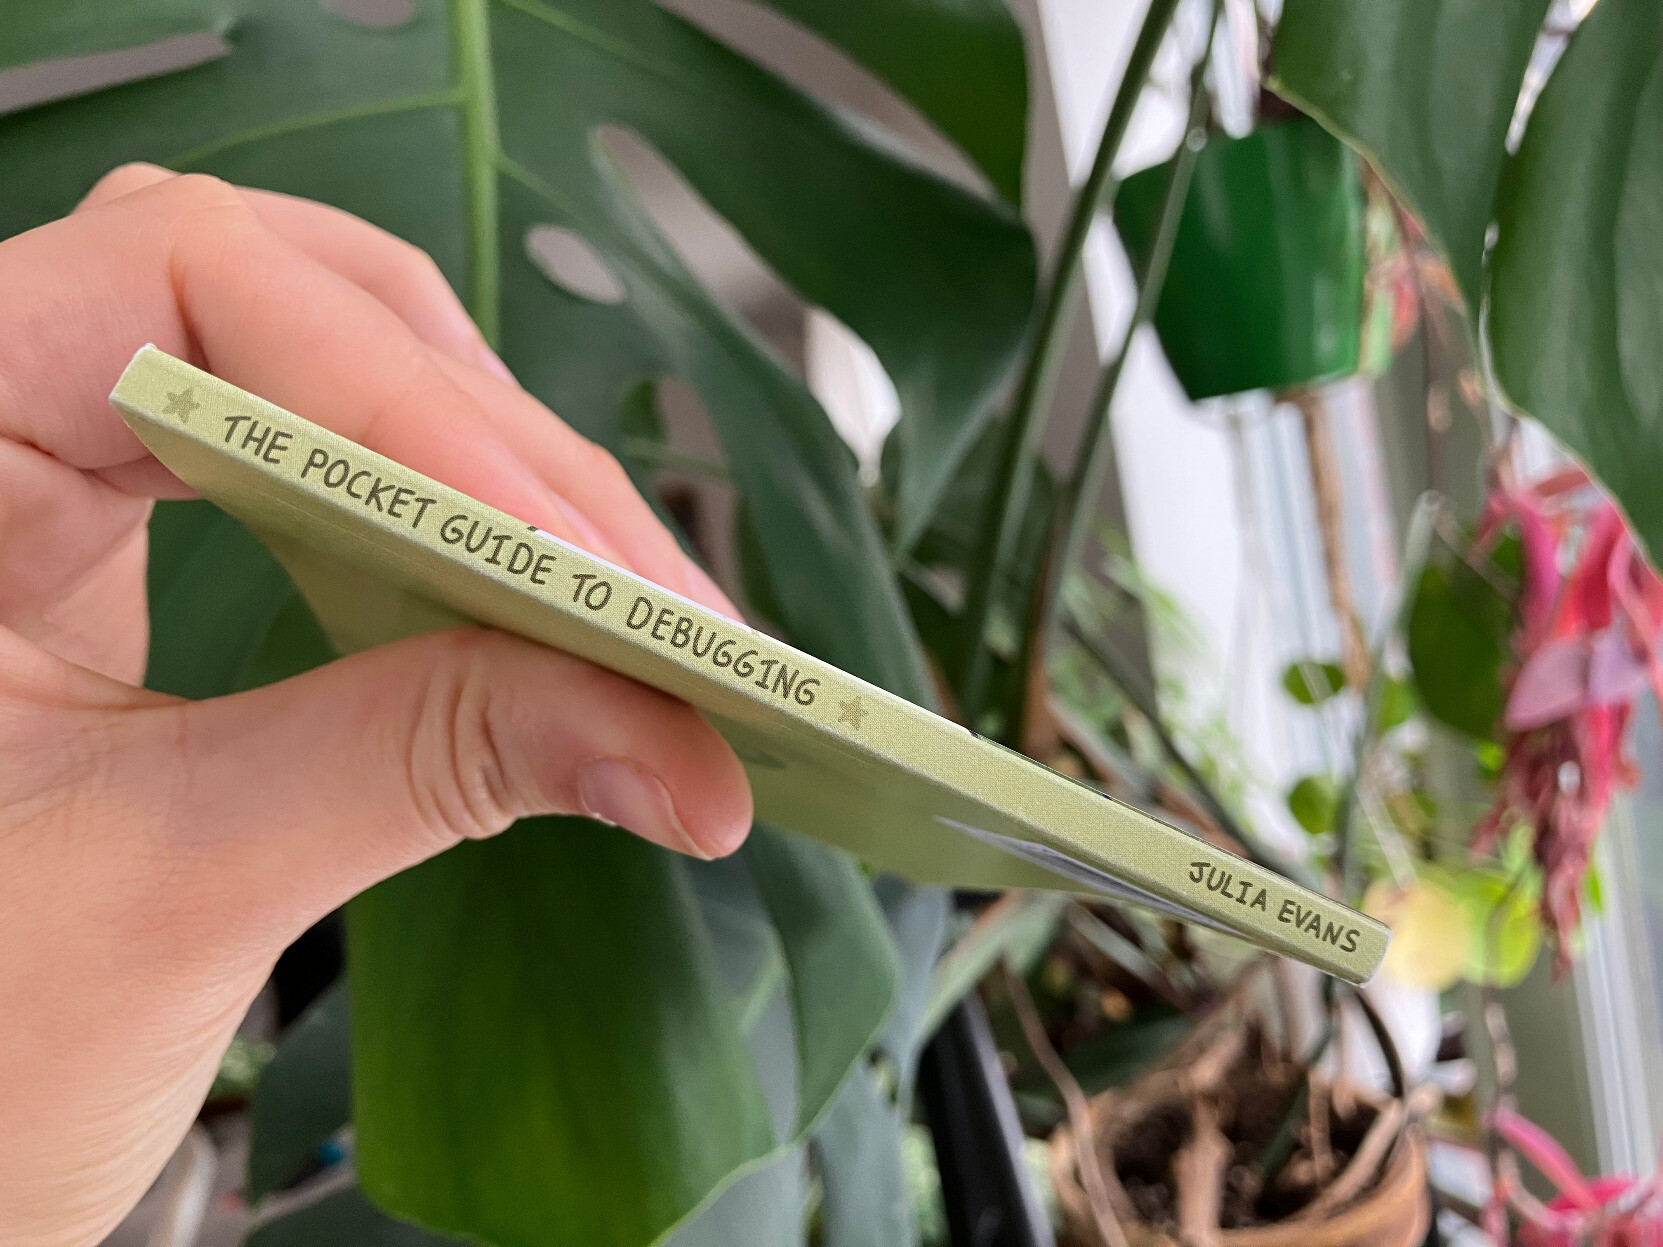
some pictures
Here are some photos of what the print version looks like:
what was involved in printing it
In case anyone is interested, here’s what was involved in putting together the print version:
- Make a PDF copy that people can print on their home printer (with a 360-line Python program)
- Test on my home printer that the “print at home version” prints properly
- Release the “print at home” version (this was back in December)
- Take a couple of weeks off, since it’s the end of the year
- Ask the illustrator to make a back cover
- Get a quote from the print company
- Agonize a bit over whether to print the zine as perfect bound or saddle stitched (stapled). Pick perfect bound.
- Find out from the print company how wide the spine has to be
- With the help of the illustrator, make a design for the spine.
- Get an ISBN number (just a couple of clicks at Libraries and Archives Canada)
- Get a bar code for the ISBN (from bookow), edit it to make it a little smaller, and put it on the back cover
- Send the new PDF to the print company and request a print proof
- Wait a week or so for the proof to get shipped across the continent
- Once the proof arrives, realize that the inner margins are too small, because it was perfect bound and perfect bound books need bigger margins (We’d already tried to account for that, but we didn’t make them big enough)
- Measure various books I have around the house and print some new sample pages to figure out the right margins
- Painstakingly manually readjust every single page to have slightly different proportions, so that I can increase the margins
- Edit the Python script to make a new PDF with the bigger margins
- Send the final files to the print company
- Wait a week for them to print 1500 copies
- The print copies arrive at the warehouse!
- Wait another 3 business days for the (amazing) folks who do the shipping to send out all 700 or so preorders
- Success!
Printing 1500 copies of something is always a little scary, but I’m really happy with how it turned out.
thanks so much to everyone who preordered!
If you preordered the print version, thanks so much for your patience – having the preorders really helps me decide how many to print.
And please let me know if something went wrong – 1 or 2 packages always get lost in the mail and while I can’t help find them, it’s very easy for me to just ship you another one :)
Why does 0.1 + 0.2 = 0.30000000000000004?
Hello! I was trying to write about floating point yesterday, and I found myself wondering about this calculation, with 64-bit floats:
>>> 0.1 + 0.2
0.30000000000000004
I realized that I didn’t understand exactly how it worked. I mean, I know
floating point calculations are inexact, and I know that you can’t exactly
represent 0.1 in binary, but: there’s a floating point number that’s closer to
0.3 than 0.30000000000000004! So why do we get the answer
0.30000000000000004?
If you don’t feel like reading this whole post with a bunch of calculations, the short answer is that
0.1000000000000000055511151231257827021181583404541015625 + 0.200000000000000011102230246251565404236316680908203125 lies exactly between
2 floating point numbers,
0.299999999999999988897769753748434595763683319091796875 (usually printed as 0.3) and
0.3000000000000000444089209850062616169452667236328125 (usually printed as 0.30000000000000004). The answer is
0.30000000000000004 (the second one) because its significand is even.
how floating point addition works
This is roughly how floating point addition works:
- Add together the numbers (with extra precision)
- Round the result to the nearest floating point number
So let’s use these rules to calculate 0.1 + 0.2. I just learned how floating point addition works yesterday so it’s possible I’ve made some mistakes in this post, but I did get the answers I expected at the end.
step 1: find out what 0.1 and 0.2 are
First, let’s use Python to figure out what the exact values of 0.1 and 0.2 are, as 64-bit floats.
>>> f"{0.1:.80f}"
'0.10000000000000000555111512312578270211815834045410156250000000000000000000000000'
>>> f"{0.2:.80f}"
'0.20000000000000001110223024625156540423631668090820312500000000000000000000000000'
These really are the exact values: because floating point numbers are in base 2, you can represent them all exactly in base 10. You just need a lot of digits sometimes :)
step 2: add the numbers together
Next, let’s add those numbers together. We can add the fractional parts together as integers to get the exact answer:
>>> 1000000000000000055511151231257827021181583404541015625 + 2000000000000000111022302462515654042363166809082031250
3000000000000000166533453693773481063544750213623046875
So the exact sum of those two floating point numbers is 0.3000000000000000166533453693773481063544750213623046875
This isn’t our final answer though because 0.3000000000000000166533453693773481063544750213623046875 isn’t a 64-bit float.
step 3: look at the nearest floating point numbers
Now, let’s look at the floating point numbers around 0.3. Here’s the closest floating point number to 0.3 (usually written as just 0.3, even though that isn’t its exact value):
>>> f"{0.3:.80f}"
'0.29999999999999998889776975374843459576368331909179687500000000000000000000000000'
We can figure out the next floating point number after 0.3 by serializing
0.3 to 8 bytes with struct.pack, adding 1, and then using struct.unpack:
>>> struct.pack("!d", 0.3)
b'?\xd3333333'
# manually add 1 to the last byte
>>> next_float = struct.unpack("!d", b'?\xd3333334')[0]
>>> next_float
0.30000000000000004
>>> f"{next_float:.80f}"
'0.30000000000000004440892098500626161694526672363281250000000000000000000000000000'
Apparently you can also do this with math.nextafter:
>>> math.nextafter(0.3, math.inf)
0.30000000000000004
So the two 64-bit floats around
0.3 are
0.299999999999999988897769753748434595763683319091796875 and
0.3000000000000000444089209850062616169452667236328125
step 4: find out which one is closest to our result
It turns out that 0.3000000000000000166533453693773481063544750213623046875
is exactly in the middle of
0.299999999999999988897769753748434595763683319091796875 and
0.3000000000000000444089209850062616169452667236328125.
You can see that with this calculation:
>>> (3000000000000000444089209850062616169452667236328125000 + 2999999999999999888977697537484345957636833190917968750) // 2 == 3000000000000000166533453693773481063544750213623046875
True
So neither of them is closest.
how does it know which one to round to?
In the binary representation of a floating point number, there’s a number called the “significand”. In cases like this (where the result is exactly in between 2 successive floating point number, it’ll round to the one with the even significand.
In this case that’s 0.300000000000000044408920985006261616945266723632812500
We actually saw the significand of this number a bit earlier:
- 0.30000000000000004 is
struct.unpack('!d', b'?\xd3333334') - 0.3 is
struct.unpack('!d', b'?\xd3333333')
The last digit of the big endian hex representation of 0.30000000000000004 is
4, so that’s the one with the even significand (because the significand is at
the end).
let’s also work out the whole calculation in binary
Above we did the calculation in decimal, because that’s a little more intuitive to read. But of course computers don’t do these calculations in decimal – they’re done in a base 2 representation. So I wanted to get an idea of how that worked too.
I don’t think this binary calculation part of the post is particularly clear but it was helpful for me to write out. There are a really a lot of numbers and it might be terrible to read.
how 64-bit floats numbers work: exponent and significand
64-bit floating point numbers are represented with 2 integers: an exponent and the significand and a 1-bit sign.
Here’s the equation of how the exponent and significand correspond to an actual number
$$\text{sign} \times 2^\text{exponent} (1 + \frac{\text{significand}}{2^{52}})$$
For example if the exponent was 1 the significand was 2**51, and the sign was positive, we’d get
$$2^{1} (1 + \frac{2^{51}}{2^{52}})$$
which is equal to 2 * (1 + 0.5) , or 3.
step 1: get the exponent and significand for 0.1 and 0.2
I wrote some inefficient functions to get the exponent and significand of a positive float in Python:
def get_exponent(f):
    # get the first 12 bytes
    bytestring = struct.pack('!d', f)
    return int.from_bytes(bytestring, byteorder='big') >> 52
def get_significand(f):
    # get the last 52 bytes
    bytestring = struct.pack('!d', f)
    x = int.from_bytes(bytestring, byteorder='big')
    exponent = get_exponent(f)
    return x ^ (exponent << 52)
I’m ignoring the sign bit (the first bit) because we only need these functions to work on two numbers (0.1 and 0.2) and those two numbers are both positive.
First, let’s get the exponent and significand of 0.1. We need to subtract 1023 to get the actual exponent because that’s how floating point works.
>>> get_exponent(0.1) - 1023
-4
>>> get_significand(0.1)
2702159776422298
The way these numbers work together to get 0.1 is 2**exponent + significand / 2**(52 - exponent).
Here’s that calculation in Python:
>>> 2**-4 + 2702159776422298 / 2**(52 + 4)
0.1
(you might legitimately be worried about floating point accuracy issues with
this calculation, but in this case I’m pretty sure it’s fine because these
numbers by definition don’t have accuracy issues – the floating point numbers starting at 2**-4 go up in steps of 1/2**(52 + 4))
We can do the same thing for 0.2:
>>> get_exponent(0.2) - 1023
-3
>>> get_significand(0.2)
2702159776422298
And here’s how that exponent and significand work together to get 0.2:
>>> 2**-3 + 2702159776422298 / 2**(52 + 3)
0.2
(by the way, it’s not a coincidence that 0.1 and 0.2 have the same significand – it’s because x and 2*x always have the same significand)
step 2: rewrite 0.1 to have a bigger exponent
0.2 has a bigger exponent than 0.1 – -3 instead of -4.
So we need to rewrite
2**-4 + 2702159776422298 / 2**(52 + 4)
to be X / (2**52 + 3)
If we solve for X in 2**-4 + 2702159776422298 / 2**(52 + 4) = X / (2**52 + 3), we get:
X = 2**51 + 2702159776422298 /2
We can calculate that in Python pretty easily:
>>> 2**51 + 2702159776422298 //2
3602879701896397
step 3: add the significands
Now we’re trying to do this addition
2**-3 + 2702159776422298 / 2**(52 + 3) + 3602879701896397 / 2**(52 + 3)
So we need to add together 2702159776422298 and 3602879701896397
>>> 2702159776422298  + 3602879701896397
6305039478318695
Cool. But 6305039478318695 is more than 2**52 - 1 (the maximum value for a significand), so we have a problem:
>>> 6305039478318695 > 2**52
True
step 4: increase the exponent
Right now our answer is
2**-3 + 6305039478318695 / 2**(52 + 3)
First, let’s subtract 2**52 to get
2**-2 + 1801439850948199 / 2**(52 + 3)
This is almost perfect, but the 2**(52 + 3) at the end there needs to be a 2**(52 + 2).
So we need to divide 1801439850948199 by 2. This is where we run into inaccuracies – 1801439850948199 is odd!
>>> 1801439850948199  / 2
900719925474099.5
It’s exactly in between two integers, so we round to the nearest even number (which is what the floating point specification says to do), so our final floating point number result is:
>>> 2**-2 + 900719925474100 / 2**(52 + 2)
0.30000000000000004
That’s the answer we expected:
>>> 0.1 + 0.2
0.30000000000000004
this probably isn’t exactly how it works in hardware
The way I’ve described the operations here isn’t literally exactly what happens when you do floating point addition (it’s not “solving for X” for example), I’m sure there are a lot of efficient tricks. But I think it’s about the same idea.
printing out floating point numbers is pretty weird
We said earlier that the floating point number 0.3 isn’t equal to 0.3. It’s actually this number:
>>> f"{0.3:.80f}"
'0.29999999999999998889776975374843459576368331909179687500000000000000000000000000'
So when you print out that number, why does it display 0.3?
The computer isn’t actually printing out the exact value of the number, instead
it’s printing out the shortest decimal number d which has the property that
our floating point number f is the closest floating point number to d.
It turns out that doing this efficiently isn’t trivial at all, and there are a bunch of academic papers about it like Printing Floating-Point Numbers Quickly and Accurately. or How to print floating point numbers accurately.
would it be more intuitive if computers printed out the exact value of a float?
Rounding to a nice clean decimal value is nice, but in a way I feel like it might be more intuitive if computers just printed out the exact value of a floating point number – it might make it seem a lot less surprising when you get weird results.
To me, 0.1000000000000000055511151231257827021181583404541015625 + 0.200000000000000011102230246251565404236316680908203125 = 0.3000000000000000444089209850062616169452667236328125 feels less surprising than 0.1 + 0.2 = 0.30000000000000004.
Probably this is a bad idea, it would definitely use a lot of screen space.
a quick note on PHP
Someone in the comments somewhere pointed out that <?php echo (0.1 + 0.2 );?>
prints out 0.3. Does that mean that floating point math is different in PHP?
I think the answer is no – if I run:
<?php echo (0.1 + 0.2 )- 0.3);?> on this
page, I get the exact same answer as in
Python 5.5511151231258E-17. So it seems like the underlying floating point
math is the same.
I think the reason that 0.1 + 0.2 prints out 0.3 in PHP is that PHP’s
algorithm for displaying floating point numbers is less precise than Python’s
– it’ll display 0.3 even if that number isn’t the closest floating point
number to 0.3.
that’s all!
I kind of doubt that anyone had the patience to follow all of that arithmetic, but it was helpful for me to write down, so I’m publishing this post anyway. Hopefully some of this makes sense.