Reading List
The most recent articles from a list of feeds I subscribe to.
Confusing git terminology
Hello! I’m slowly working on explaining git. One of my biggest problems is that after almost 15 years of using git, I’ve become very used to git’s idiosyncracies and it’s easy for me to forget what’s confusing about it.
So I asked people on Mastodon:
what git jargon do you find confusing? thinking of writing a blog post that explains some of git’s weirder terminology: “detached HEAD state”, “fast-forward”, “index/staging area/staged”, “ahead of ‘origin/main’ by 1 commit”, etc
I got a lot of GREAT answers and I’ll try to summarize some of them here. Here’s a list of the terms:
- HEAD and “heads”
- “detached HEAD state”
- “ours” and “theirs” while merging or rebasing
- “Your branch is up to date with ‘origin/main’”
- HEAD^, HEAD~ HEAD^^, HEAD~~, HEAD^2, HEAD~2
- .. and …
- “can be fast-forwarded”
- “reference”, “symbolic reference”
- refspecs
- “tree-ish”
- “index”, “staged”, “cached”
- “reset”, “revert”, “restore”
- “untracked files”, “remote-tracking branch”, “track remote branch”
- checkout
- reflog
- merge vs rebase vs cherry-pick
- rebase –onto
- commit
- more confusing terms
I’ve done my best to explain what’s going on with these terms, but they cover basically every single major feature of git which is definitely too much for a single blog post so it’s pretty patchy in some places.
HEAD and “heads”
A few people said they were confused by the terms HEAD and refs/heads/main,
because it sounds like it’s some complicated technical internal thing.
Here’s a quick summary:
- “heads” are “branches”. Internally in git, branches are stored in a directory called
.git/refs/heads. (technically the official git glossary says that the branch is all the commits on it and the head is just the most recent commit, but they’re 2 different ways to think about the same thing) HEADis the current branch. It’s stored in.git/HEAD.
I think that “a head is a branch, HEAD is the current branch” is a good
candidate for the weirdest terminology choice in git, but it’s definitely too
late for a clearer naming scheme so let’s move on.
There are some important exceptions to “HEAD is the current branch”, which we’ll talk about next.
“detached HEAD state”
You’ve probably seen this message:
$ git checkout v0.1
You are in 'detached HEAD' state. You can look around, make experimental
changes and commit them, and you can discard any commits you make in this
state without impacting any branches by switching back to a branch.

[...]
Here’s the deal with this message:
- In Git, usually you have a “current branch” checked out, for example
main. - The place the current branch is stored is called
HEAD. - Any new commits you make will get added to your current branch, and if you run
git merge other_branch, that will also affect your current branch - But
HEADdoesn’t have to be a branch! Instead it can be a commit ID. - Git calls this state (where HEAD is a commit ID instead of a branch) “detached HEAD state”
- For example, you can get into detached HEAD state by checking out a tag, because a tag isn’t a branch
- if you don’t have a current branch, a bunch of things break:
git pulldoesn’t work at all (since the whole point of it is to update your current branch)- neither does
git pushunless you use it in a special way git commit,git merge,git rebase, andgit cherry-pickdo still work, but they’ll leave you with “orphaned” commits that aren’t connected to any branch, so those commits will be hard to find
- You can get out of detached HEAD state by either creating a new branch or switching to an existing branch
“ours” and “theirs” while merging or rebasing
If you have a merge conflict, you can run git checkout --ours file.txt to pick the version of file.txt from the “ours” side. But which side is “ours” and which side is “theirs”?
I always find this confusing and I never use git checkout --ours because of
that, but I looked it up to see which is which.
For merges, here’s how it works: the current branch is “ours” and the branch you’re merging in is “theirs”, like this. Seems reasonable.
$ git checkout merge-into-ours # current branch is "ours"
$ git merge from-theirs # branch we're merging in is "theirs"
For rebases it’s the opposite – the current branch is “theirs” and the target branch we’re rebasing onto is “ours”, like this:
$ git checkout theirs # current branch is "theirs"
$ git rebase ours # branch we're rebasing onto is "ours"
I think the reason for this is that under the hood git rebase main is
repeatedly merging commits from the current branch into a copy of the main branch (you can
see what I mean by that in this weird shell script the implements git rebase using git merge. But I
still find it confusing.
This nice tiny site explains the “ours” and “theirs” terms.
A couple of people also mentioned that VSCode calls “ours”/“theirs” “current change”/“incoming change”, and that it’s confusing in the exact same way.
“Your branch is up to date with ‘origin/main’”
This message seems straightforward – it’s saying that your main branch is up
to date with the origin!
But it’s actually a little misleading. You might think that this means that
your main branch is up to date. It doesn’t. What it actually means is –
if you last ran git fetch or git pull 5 days ago, then your main branch
is up to date with all the changes as of 5 days ago.
So if you don’t realize that, it can give you a false sense of security.
I think git could theoretically give you a more useful message like “is up to
date with the origin’s main as of your last fetch 5 days ago” because the time
that the most recent fetch happened is stored in the reflog, but it doesn’t.
HEAD^, HEAD~ HEAD^^, HEAD~~, HEAD^2, HEAD~2
I’ve known for a long time that HEAD^ refers to the previous commit, but I’ve
been confused for a long time about the difference between HEAD~ and HEAD^.
I looked it up, and here’s how these relate to each other:
HEAD^andHEAD~are the same thing (1 commit ago)HEAD^^^andHEAD~~~andHEAD~3are the same thing (3 commits ago)HEAD^3refers the the third parent of a commit, and is different fromHEAD~3
This seems weird – why are HEAD~ and HEAD^ the same thing? And what’s the
“third parent”? Is that the same thing as the parent’s parent’s parent? (spoiler: it
isn’t) Let’s talk about it!
Most commits have only one parent. But merge commits have multiple parents –
they’re merging together 2 or more commits. In Git HEAD^ means “the parent of
the HEAD commit”. But what if HEAD is a merge commit? What does HEAD^ refer
to?
The answer is that HEAD^ refers to the the first parent of the merge,
HEAD^2 is the second parent, HEAD^3 is the third parent, etc.
But I guess they also wanted a way to refer to “3 commits ago”, so HEAD^3 is
the third parent of the current commit (which may have many parents if it’s a merge commit), and HEAD~3 is the parent’s parent’s
parent.
I think in the context of the merge commit ours/theirs discussion earlier, HEAD^ is “ours” and HEAD^2 is “theirs”.
.. and ...
Here are two commands:
git log main..testgit log main...test
What’s the difference between .. and ...? I never use these so I had to look it up in man git-range-diff. It seems like the answer is that in this case:
A - B main
  \
    C - D test
main..testis commits C and Dtest..mainis commit Bmain...testis commits B, C, and D
But it gets worse: apparently git diff also supports .. and ..., but
they do something completely different than they do with git log? I think the summary is:
git log test..mainshows changes onmainthat aren’t ontest, whereasgit log test...mainshows changes on both sides.git diff test..mainshowstestchanges andmainchanges (it diffsBandD) whereasgit diff test...maindiffsAandD(it only shows you the diff on one side).
this blog post talks about it a bit more.
“can be fast-forwarded”
Here’s a very common message you’ll see in git status:
$ git status
On branch main
Your branch is behind 'origin/main' by 2 commits, and can be fast-forwarded.
  (use "git pull" to update your local branch)
What does “fast-forwarded” mean? Basically it’s trying to say that the two branches look something like this: (newest commits are on the right)
main:        A - B - C
origin/main: A - B - C - D - E
or visualized another way:
A - B - C - D - E (origin/main)
        |
       main
Here origin/main just has 2 extra commits that main doesn’t have, so it’s
easy to bring main up to date – we just need to add those 2 commits.
Literally nothing can possibly go wrong – there’s no possibility of merge
conflicts. A fast forward merge is a very good thing! It’s the easiest way to combine 2 branches.
After running git pull, you’ll end up this state:
main:        A - B - C - D - E
origin/main: A - B - C - D - E
Here’s an example of a state which can’t be fast-forwarded.
             A - B - C - X  (main)
                     |
                     - - D - E  (origin/main)
Here main has a commit that origin/main doesn’t have (X). So
you can’t do a fast forward. In that case, git status would say:
$ git status
Your branch and 'origin/main' have diverged,
and have 1 and 2 different commits each, respectively.
“reference”, “symbolic reference”
I’ve always found the term “reference” kind of confusing. There are at least 3 things that get called “references” in git
- branches and tags like
mainandv0.2 HEAD, which is the current branch- things like
HEAD^^^which git will resolve to a commit ID. Technically these are probably not “references”, I guess git calls them “revision parameters” but I’ve never used that term.
“symbolic reference” is a very weird term to me because personally I think the only
symbolic reference I’ve ever used is HEAD (the current branch), and HEAD
has a very central place in git (most of git’s core commands’ behaviour depends
on the value of HEAD), so I’m not sure what the point of having it as a
generic concept is.
refspecs
When you configure a git remote in .git/config, there’s this +refs/heads/main:refs/remotes/origin/main thing.
[remote "origin"]
	url = git@github.com:jvns/pandas-cookbook
	fetch = +refs/heads/main:refs/remotes/origin/main
I don’t really know what this means, I’ve always just used whatever the default
is when you do a git clone or git remote add, and I’ve never felt any
motivation to learn about it or change it from the default.
“tree-ish”
The man page for git checkout says:
git checkout [-f|--ours|--theirs|-m|--conflict=<style>] [<tree-ish>] [--] <pathspec>...
What’s tree-ish??? What git is trying to say here is when you run git checkout THING ., THING can be either:
- a commit ID (like
182cd3f) - a reference to a commit ID (like
mainorHEAD^^orv0.3.2) - a subdirectory inside a commit (like
main:./docs) - I think that’s it????
Personally I’ve never used the “directory inside a commit” thing and from my perspective “tree-ish” might as well just mean “commit or reference to commit”.
“index”, “staged”, “cached”
All of these refer to the exact same thing (the file .git/index, which is where your changes are staged when you run git add):
git diff --cachedgit rm --cachedgit diff --staged- the file
.git/index
Even though they all ultimately refer to the same file, there’s some variation in how those terms are used in practice:
- Apparently the flags
--indexand--cacheddo not generally mean the same thing. I have personally never used the--indexflag so I’m not going to get into it, but this blog post by Junio Hamano (git’s lead maintainer) explains all the gnarly details - the “index” lists untracked files (I guess for performance reasons) but you don’t usually think of the “staging area” as including untracked files”
“reset”, “revert”, “restore”
A bunch of people mentioned that “reset”, “revert” and “restore” are very similar words and it’s hard to differentiate them.
I think it’s made worse because
git reset --hardandgit restore .on their own do basically the same thing. (thoughgit reset --hard COMMITandgit restore --source COMMIT .are completely different from each other)- the respective man pages don’t give very helpful descriptions:
git reset: “Reset current HEAD to the specified state”git revert: “Revert some existing commits”git restore: “Restore working tree files”
Those short descriptions do give you a better sense for which noun is being affected (“current HEAD”, “some commits”, “working tree files”) but they assume you know what “reset”, “revert” and “restore” mean in this context.
Here are some short descriptions of what they each do:
git revert COMMIT: Create a new commit that’s the “opposite” of COMMIT on your current branch (if COMMIT added 3 lines, the new commit will delete those 3 lines)git reset --hard COMMIT: Force your current branch back to the state it was atCOMMIT, erasing any new changes sinceCOMMIT. Very dangerous operation.git restore --source=COMMIT PATH: Take all the files inPATHback to how they were atCOMMIT, without changing any other files or commit history.
“untracked files”, “remote-tracking branch”, “track remote branch”
Git uses the word “track” in 3 different related ways:
Untracked files:in the output ofgit status. This means those files aren’t managed by Git and won’t be included in commits.- a “remote tracking branch” like
origin/main. This is a local reference, and it’s the commit ID thatmainpointed to on the remoteoriginthe last time you rangit pullorgit fetch. - “branch foo set up to track remote branch bar from origin”
The “untracked files” and “remote tracking branch” thing is not too bad – they both use “track”, but the context is very different. No big deal. But I think the other two uses of “track” are actually quite confusing:
mainis a branch that tracks a remoteorigin/mainis a remote-tracking branch
But a “branch that tracks a remote” and a “remote-tracking branch” are different things in Git and the distinction is pretty important! Here’s a quick summary of the differences:
mainis a branch. You can make commits to it, merge into it, etc. It’s often configured to “track” the remotemainin.git/config, which means that you can usegit pullandgit pushto push/pull changes.origin/mainis not a branch. It’s a “remote-tracking branch”, which is not a kind of branch (I’m sorry). You can’t make commits to it. The only way you can update it is by runninggit pullorgit fetchto get the latest state ofmainfrom the remote.
I’d never really thought about this ambiguity before but I think it’s pretty easy to see why folks are confused by it.
checkout
Checkout does two totally unrelated things:
git checkout BRANCHswitches branchesgit checkout file.txtdiscards your unstaged changes tofile.txt
This is well known to be confusing and git has actually split those two
functions into git switch and git restore (though you can still use
checkout if, like me, you have 15 years of muscle memory around git checkout
that you don’t feel like unlearning)
Also personally after 15 years I still can’t remember the order of the
arguments to git checkout main file.txt for restoring the version of
file.txt from the main branch.
I think sometimes you need to pass -- to checkout as an argument somewhere
to help it figure out which argument is a branch and which ones are paths but I
never do that and I’m not sure when it’s needed.
reflog
Lots of people mentioning reading reflog as re-flog and not ref-log. I
won’t get deep into the reflog here because this post is REALLY long but:
- “reference” is an umbrella term git uses for branches, tags, and HEAD
- the reference log (“reflog”) gives you the history of everything a reference has ever pointed to
- It can help get you out of some VERY bad git situations, like if you accidentally delete an important branch
- I find it one of the most confusing parts of git’s UI and I try to avoid needing to use it.
merge vs rebase vs cherry-pick
A bunch of people mentioned being confused about the difference between merge and rebase and not understanding what the “base” in rebase was supposed to be.
I’ll try to summarize them very briefly here, but I don’t think these 1-line explanations are that useful because people structure their workflows around merge / rebase in pretty different ways and to really understand merge/rebase you need to understand the workflows. Also pictures really help. That could really be its whole own blog post though so I’m not going to get into it.
- merge creates a single new commit that merges the 2 branches
- rebase copies commits on the current branch to the target branch, one at a time.
- cherry-pick is similar to rebase, but with a totally different syntax (one big difference is that rebase copies commits FROM the current branch, cherry-pick copies commits TO the current branch)
rebase --onto
git rebase has an flag called onto. This has always seemed confusing to me
because the whole point of git rebase main is to rebase the current branch
onto main. So what’s the extra onto argument about?
I looked it up, and --onto definitely solves a problem that I’ve rarely/never
actually had, but I guess I’ll write down my understanding of it anyway.
A - B - C (main)
     \
      D - E - F - G (mybranch)
          |
          otherbranch
Imagine that for some reason I just want to move commits F and G to be
rebased on top of main. I think there’s probably some git workflow where this
comes up a lot.
Apparently you can run git rebase --onto main otherbranch mybranch to do
that. It seems impossible to me to remember the syntax for this (there are 3
different branch names involved, which for me is too many), but I heard about it from a
bunch of people so I guess it must be useful.
commit
Someone mentioned that they found it confusing that commit is used both as a verb and a noun in git.
for example:
- verb: “Remember to commit often”
- noun: “the most recent commit on
main“
My guess is that most folks get used to this relatively quickly, but this use of “commit” is different from how it’s used in SQL databases, where I think “commit” is just a verb (you “COMMIT” to end a transaction) and not a noun.
Also in git you can think of a Git commit in 3 different ways:
- a snapshot of the current state of every file
- a diff from the parent commit
- a history of every previous commit
None of those are wrong: different commands use commits in all of these ways.
For example git show treats a commit as a diff, git log treats it as a
history, and git restore treats it as a snapshot.
But git’s terminology doesn’t do much to help you understand in which sense a commit is being used by a given command.
more confusing terms
Here are a bunch more confusing terms. I don’t know what a lot of these mean.
things I don’t really understand myself:
- “the git pickaxe” (maybe this is
git log -Sandgit log -G, for searching the diffs of previous commits?) - submodules (all I know is that they don’t work the way I want them to work)
- “cone mode” in git sparse checkout (no idea what this is but someone mentioned it)
things that people mentioned finding confusing but that I left out of this post because it was already 3000 words:
- blob, tree
- the direction of “merge”
- “origin”, “upstream”, “downstream”
- that
pushandpullaren’t opposites - the relationship between
fetchandpull(pull = fetch + merge) - git porcelain
- subtrees
- worktrees
- the stash
- “master” or “main” (it sounds like it has a special meaning inside git but it doesn’t)
- when you need to use
origin main(likegit push origin main) vsorigin/main
github terms people mentioned being confused by:
- “pull request” (vs “merge request” in gitlab which folks seemed to think was clearer)
- what “squash and merge” and “rebase and merge” do (I’d never actually heard of
git merge --squashuntil yesterday, I thought “squash and merge” was a special github feature)
it’s genuinely “every git term”
I was surprised that basically every other core feature of git was mentioned by at least one person as being confusing in some way. I’d be interested in hearing more examples of confusing git terms that I missed too.
There’s another great post about this from 2012 called the most confusing git terminology. It talks more about how git’s terminology relates to CVS and Subversion’s terminology.
If I had to pick the 3 most confusing git terms, I think right now I’d pick:
- a
headis a branch,HEADis the current branch - “remote tracking branch” and “branch that tracks a remote” being different things
- how “index”, “staged”, “cached” all refer to the same thing
that’s all!
I learned a lot from writing this – I learned a few new facts about git, but more importantly I feel like I have a slightly better sense now for what someone might mean when they say that everything in git is confusing.
I really hadn’t thought about a lot of these issues before – like I’d never realized how “tracking” is used in such a weird way when discussing branches.
Also as usual I might have made some mistakes, especially since I ended up in a bunch of corners of git that I hadn’t visited before.
Also a very quick plug: I’m working on writing a zine about git, if you’re interested in getting an email when it comes out you can sign up to my very infrequent announcements mailing list.
translations of this post
Some miscellaneous git facts
I’ve been very slowly working on writing about how Git works. I thought I already knew Git pretty well, but as usual when I try to explain something I’ve been learning some new things.
None of these things feel super surprising in retrospect, but I hadn’t thought about them clearly before.
The facts are:
- the “index”, “staging area” and “–cached” are all the same thing
- the stash is a bunch of commits
- not all references are branches or tags
- merge commits aren’t empty
Let’s talk about them!
the “index”, “staging area” and “–cached” are all the same thing
When you run git add file.txt, and then git status, you’ll see something like this:
$ git add content/post/2023-10-20-some-miscellaneous-git-facts.markdown
$ git status
Changes to be committed:
  (use "git restore --staged <file>..." to unstage)
	new file:   content/post/2023-10-20-some-miscellaneous-git-facts.markdown
People usually call this “staging a file” or “adding a file to the staging area”.
When you stage a file with git add, behind the scenes git adds the file to its object
database (in .git/objects) and updates a file called .git/index to refer to
the newly added file.
This “staging area” actually gets referred to by 3 different names in Git. All
of these refer to the exact same thing (the file .git/index):
git diff --cachedgit diff --staged- the file
.git/index
I felt like I should have realized this earlier, but I didn’t, so there it is.
the stash is a bunch of commits
When I run git stash to stash my changes, I’ve always been a bit confused
about where those changes actually went. It turns out that when you run git
stash, git makes some commits with your changes and labels them with a reference
called stash (in .git/refs/stash).
Let’s stash this blog post and look at the log of the stash reference:
$ git log stash --oneline
6cb983fe (refs/stash) WIP on main: c6ee55ed wip
2ff2c273 index on main: c6ee55ed wip
... some more stuff
Now we can look at the commit 2ff2c273 to see what it contains:
$ git show 2ff2c273 --stat
commit 2ff2c273357c94a0087104f776a8dd28ee467769
Author: Julia Evans <julia@jvns.ca>
Date: Fri Oct 20 14:49:20 2023 -0400
index on main: c6ee55ed wip
content/post/2023-10-20-some-miscellaneous-git-facts.markdown | 40 ++++++++++++++++++++++++++++++++++++++++
Unsurprisingly, it contains this blog post. Makes sense!
git stash actually creates 2 separate commits: one for the index, and one for
your changes that you haven’t staged yet. I found this kind of heartening
because I’ve been working on a tool to snapshot and restore the state of a git
repository (that I may or may not ever release) and I came up with a very
similar design, so that made me feel better about my choices.
Apparently older commits in the stash are stored in the reflog.
not all references are branches or tags
Git’s documentation often refers to “references” in a generic way that I find
a little confusing sometimes. Personally 99% of the time when I deal with
a “reference” in Git it’s a branch or HEAD and the other 1% of the time it’s a tag. I
actually didn’t know ANY examples of references that weren’t branches or tags or HEAD.
But now I know one example – the stash is a reference, and it’s not a branch or tag! So that’s cool.
Here are all the references in my blog’s git repository (other than HEAD):
$ find .git/refs -type f
.git/refs/heads/main
.git/refs/remotes/origin/HEAD
.git/refs/remotes/origin/main
.git/refs/stash
Some other references people mentioned in reponses to this post:
refs/notes/*, fromgit notesrefs/pull/123/head, and `refs/pull/123/headfor GitHub pull requests (which you can get withgit fetch origin refs/pull/123/merge)refs/bisect/*, fromgit bisect
merge commits aren’t empty
Here’s a toy git repo where I created two branches x and y, each with 1
file (x.txt and y.txt) and merged them. Let’s look at the merge commit.
$ git log --oneline
96a8afb (HEAD -> y) Merge branch 'x' into y
0931e45 y
1d8bd2d (x) x
If I run git show 96a8afb, the commit looks “empty”: there’s no diff!
git show 96a8afb
commit 96a8afbf776c2cebccf8ec0dba7c6c765ea5d987 (HEAD -> y)
Merge: 0931e45 1d8bd2d
Author: Julia Evans <julia@jvns.ca>
Date:   Fri Oct 20 14:07:00 2023 -0400

    Merge branch 'x' into y
But if I diff the merge commit against each of its two parent commits separately, you can see that of course there is a diff:
$ git diff 0931e45 96a8afb   --stat
 x.txt | 1 +
 1 file changed, 1 insertion(+)
$ git diff 1d8bd2d 96a8afb   --stat
 y.txt | 1 +
 1 file changed, 1 insertion(+)
It seems kind of obvious in retrospect that merge commits aren’t actually “empty” (they’re snapshots of the current state of the repo, just like any other commit), but I’d never thought about why they appear to be empty.
Apparently the reason that these merge diffs are empty is that merge diffs only show conflicts – if I instead create a repo
with a merge conflict (one branch added x and another branch added y to the
same file), and show the merge commit where I resolved the conflict, it looks
like this:
$ git show HEAD
commit 3bfe8311afa4da867426c0bf6343420217486594
Merge: 782b3d5 ac7046d
Author: Julia Evans <julia@jvns.ca>
Date:   Fri Oct 20 15:29:06 2023 -0400

    Merge branch 'x' into y

diff --cc file.txt
index 975fbec,587be6b..b680253
--- a/file.txt
+++ b/file.txt
@@@ -1,1 -1,1 +1,1 @@@
- y
 -x
++z
It looks like this is trying to tell me that one branch added x, another
branch added y, and the merge commit resolved it by putting z instead. But
in the earlier example, there was no conflict, so Git didn’t display a diff at all.
(thanks to Jordi for telling me how merge diffs work)
that’s all!
I’ll keep this post short, maybe I’ll write another blog post with more git facts as I learn them.
New talk: Making Hard Things Easy
A few weeks ago I gave a keynote at Strange Loop called Making Hard Things Easy. It’s about why I think some things are hard to learn and ideas for how we can make them easier.
Here’s the video, as well as the slides and a transcript of (roughly) what I said in the talk.
the video
the transcript


I often give talks about things that I'm excited about, or that I think are really fun.
But today, I want to talk about something that I'm a little bit mad about, which is that sometimes things that seem like they should be basic take me 10 years or 20 years to learn, way longer than it seems like they should.
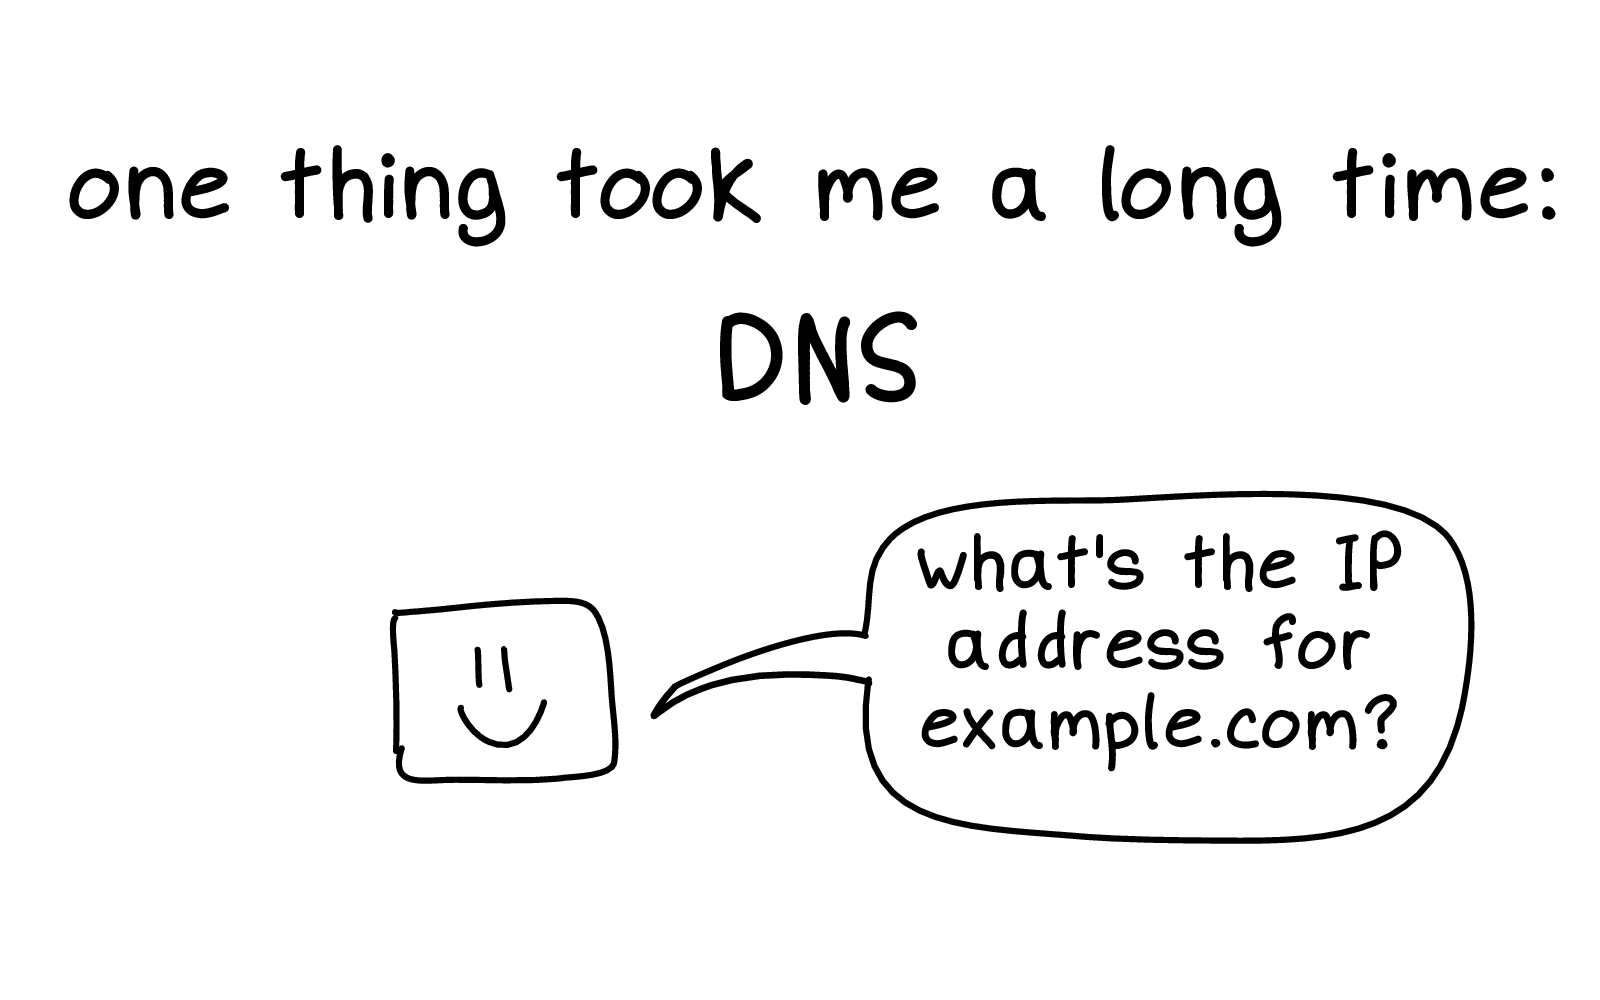
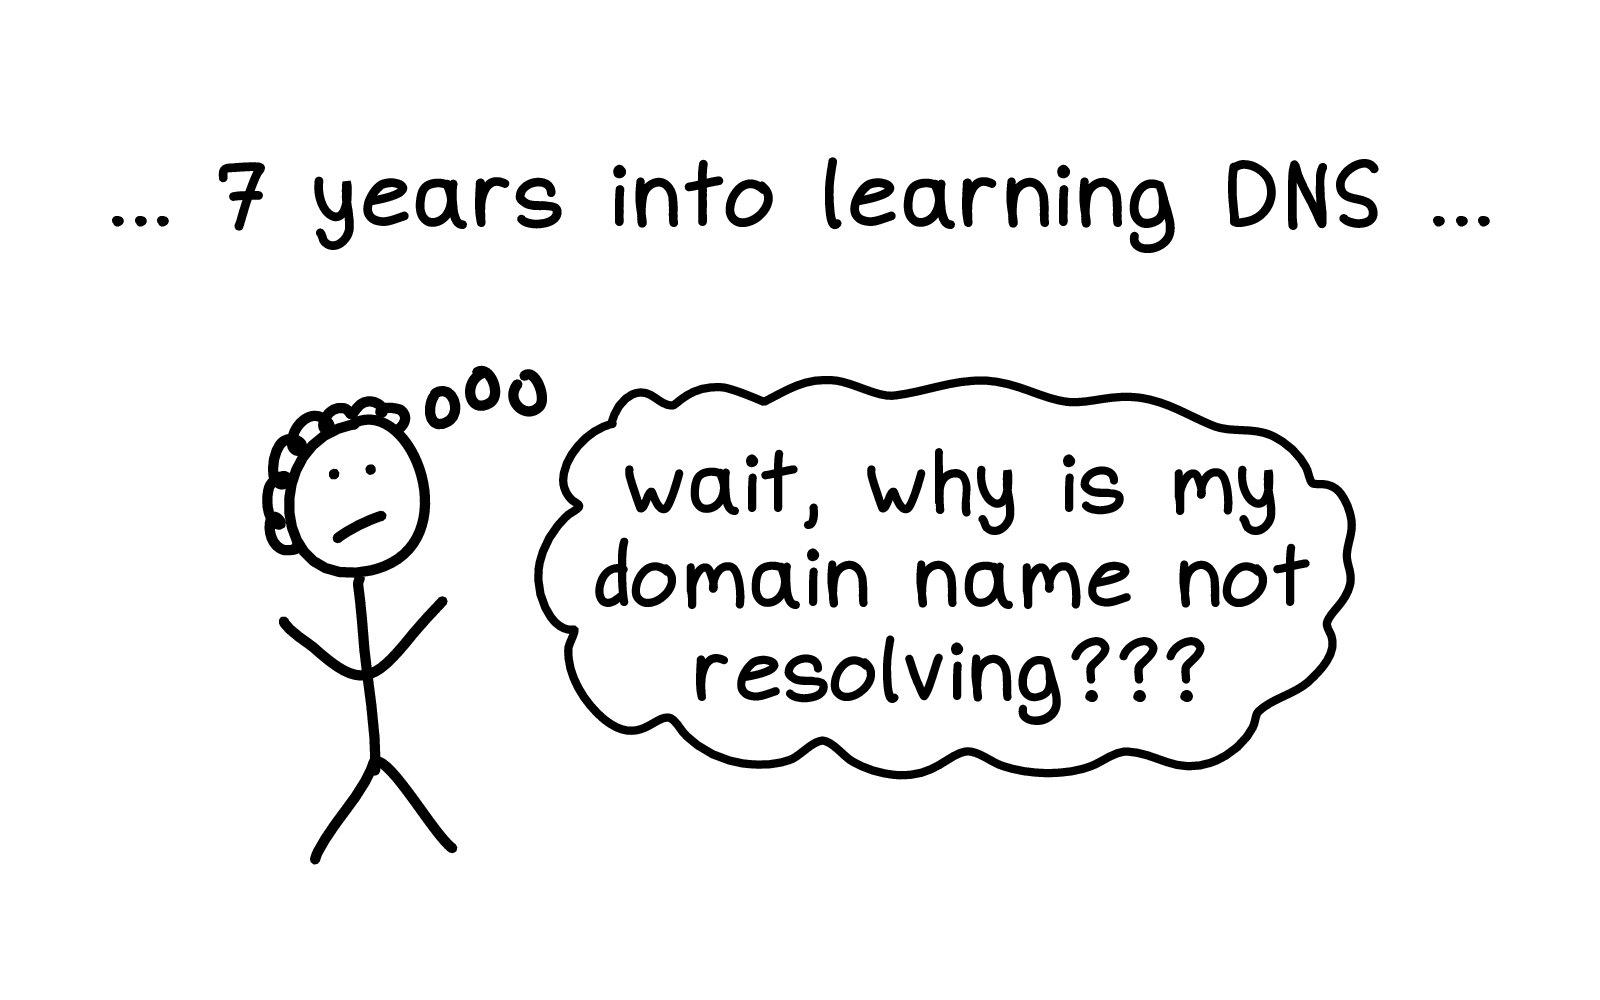

And sometimes this would feel kind of personal! This shouldn't be so hard for me! I should understand this already. It's been seven years!
And this "it's just me" attitude is often encouraged -- when I write about finding things hard to learn on the Internet, Internet strangers will sometimes tell me: "yeah, this is easy! You should get it already! Maybe you're just not very smart!"
But luckily I have a pretty big ego so I don't take the internet strangers too seriously. And I have a lot of patience so I'm willing to keep coming back to a topic I'm confused about. There were maybe four different things that were going wrong with DNS in my life and eventually I figured them all out.
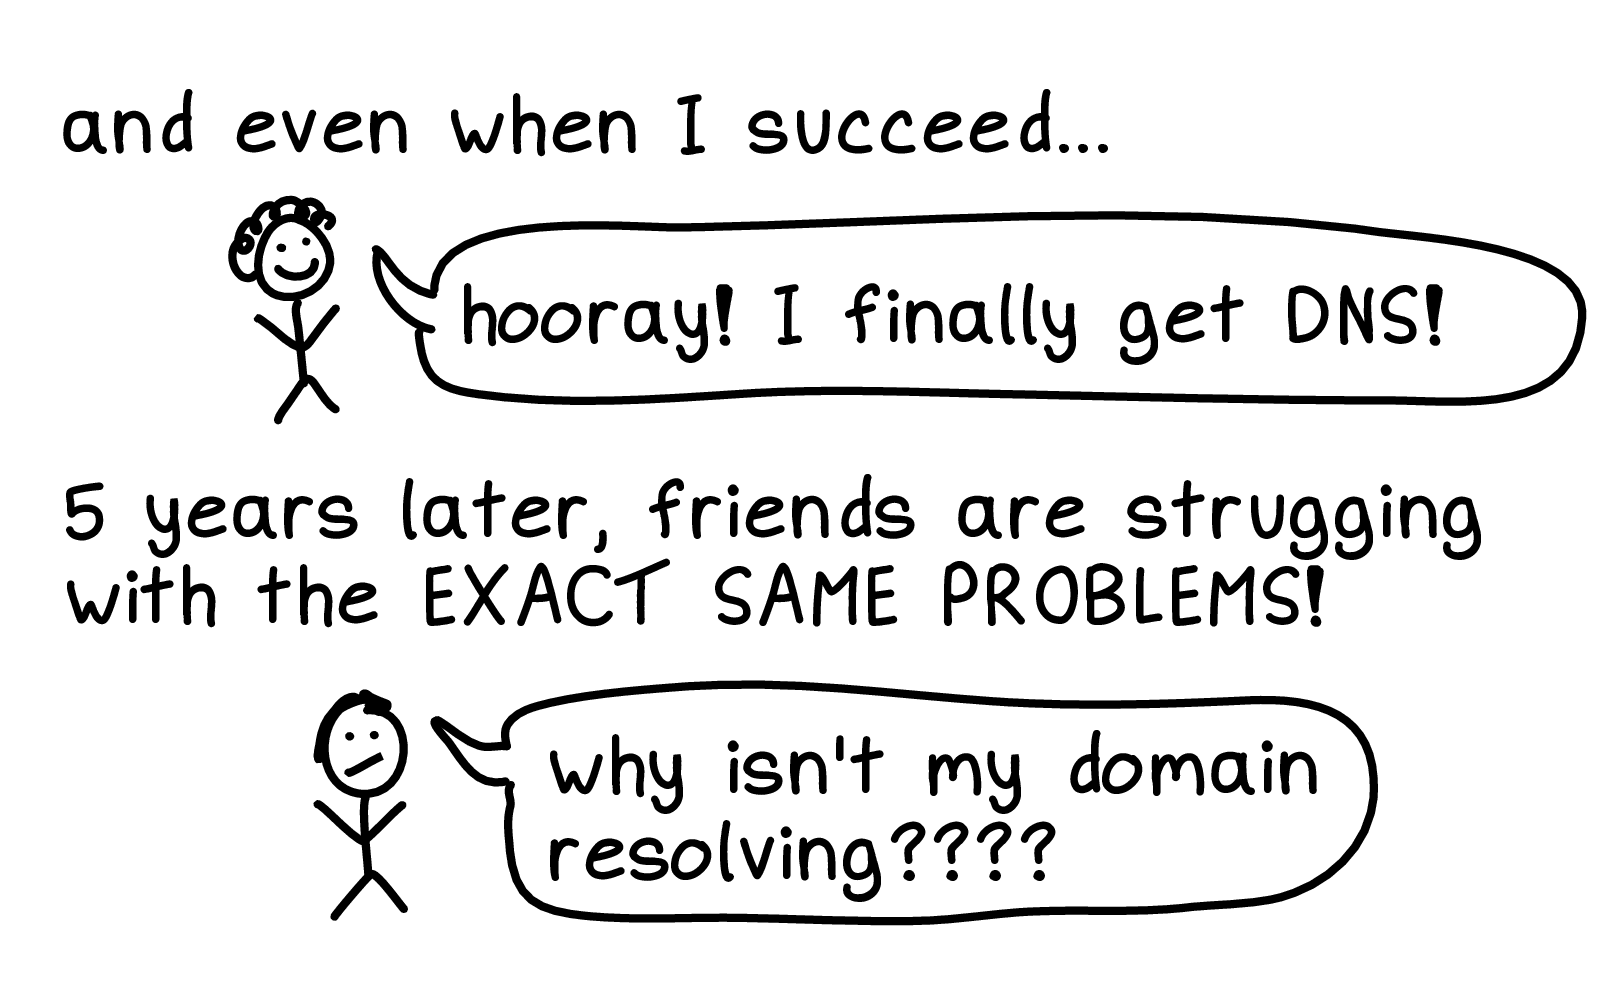
So, hooray! I understood DNS! I win! But then I see some of my friends struggling with the exact same things.
They're wondering, hey, my DNS isn't working. Why not?
And it doesn't end. We're still having the same problems over and over and over again. And it's frustrating! It feels redundant! It makes me mad. Especially when friends take it personally, and they feel like "hey I should really understand this already".
Because everyone is going through this. From the sounds of recognition I hear, I think a lot of you have been through some of these same problems with DNS.


I started a little publishing company called Wizard Zines where --
(applause)
Wow. Where I write about some of these topics and try to demystify them.

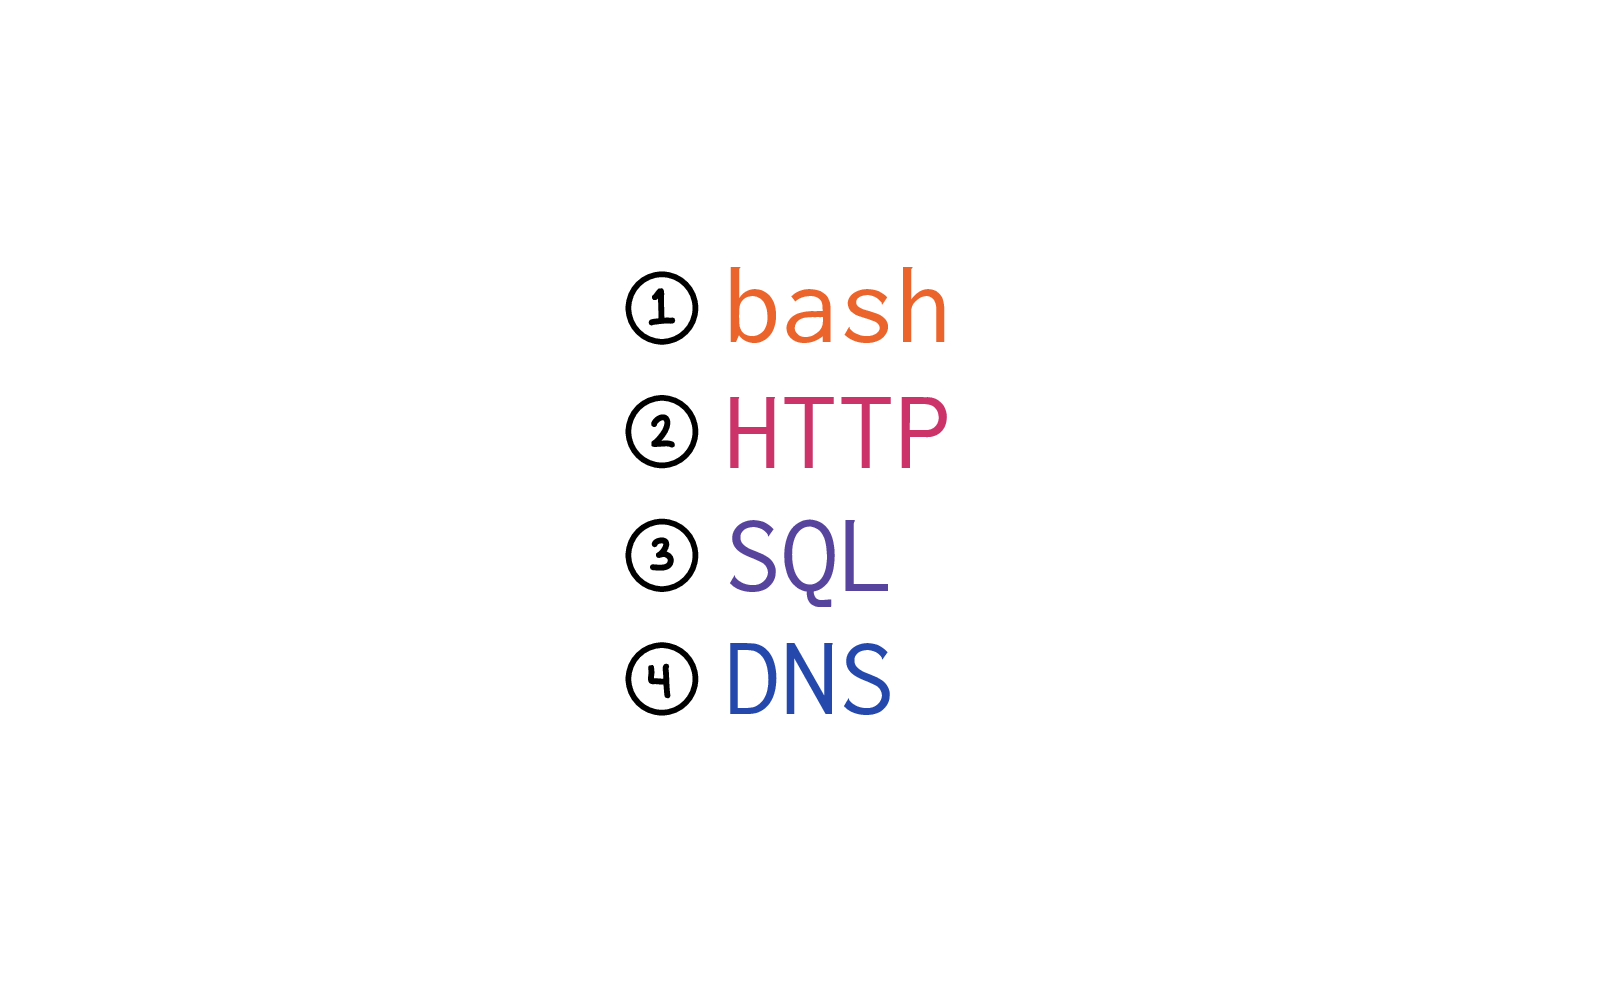
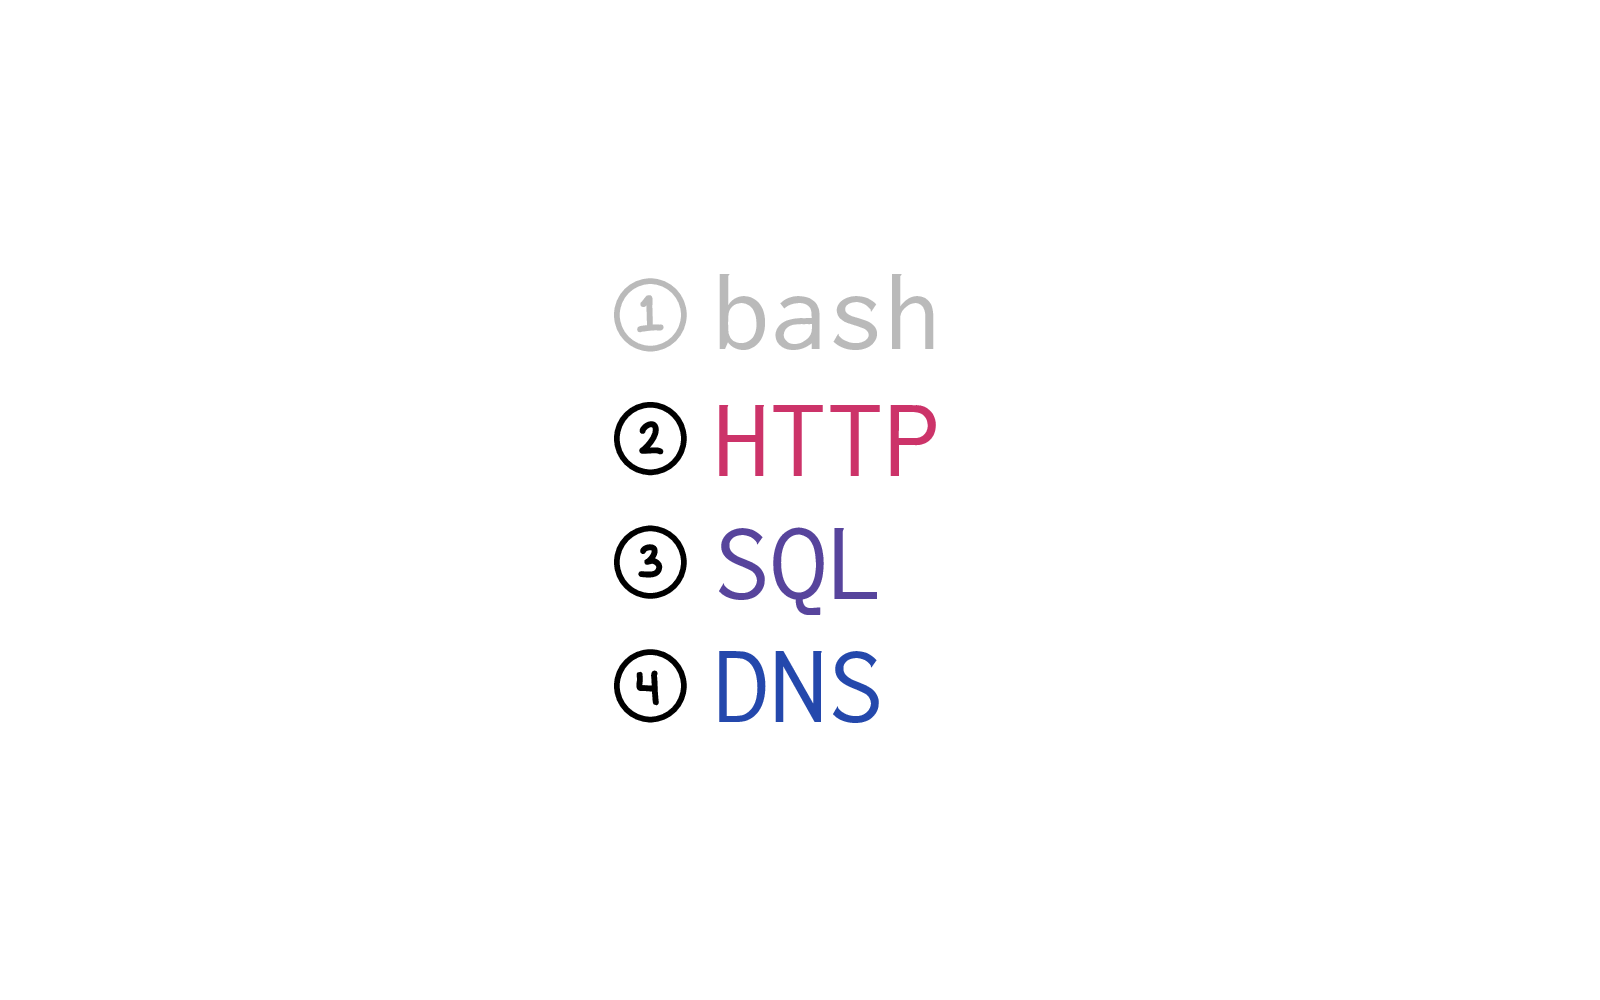
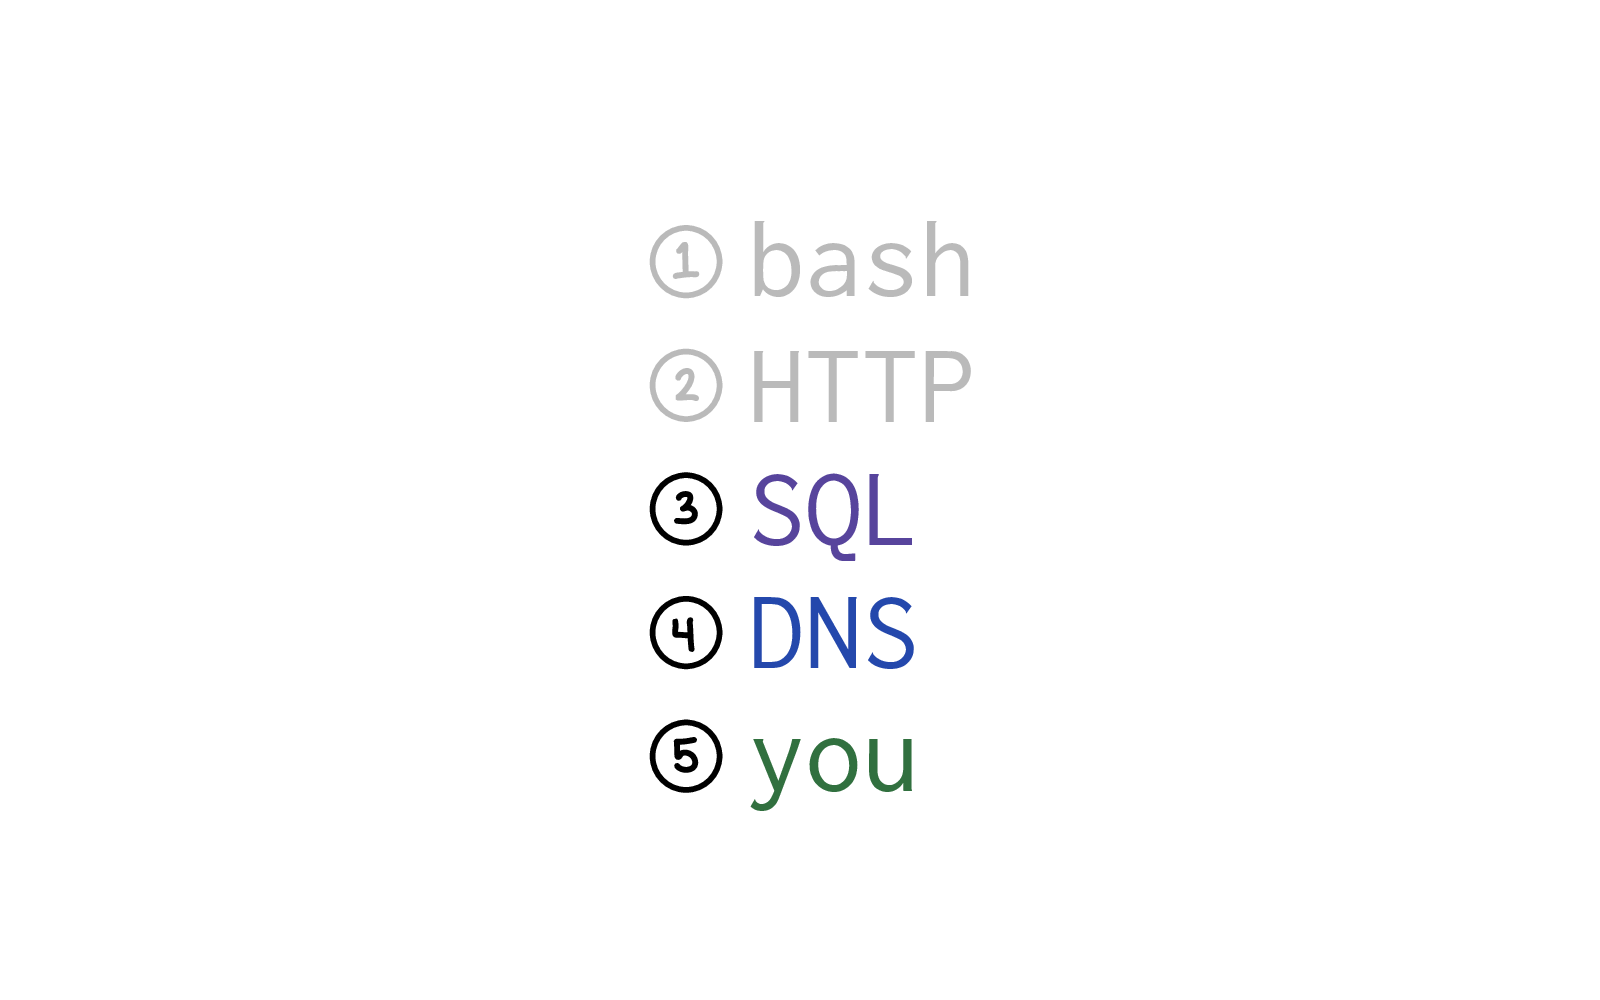
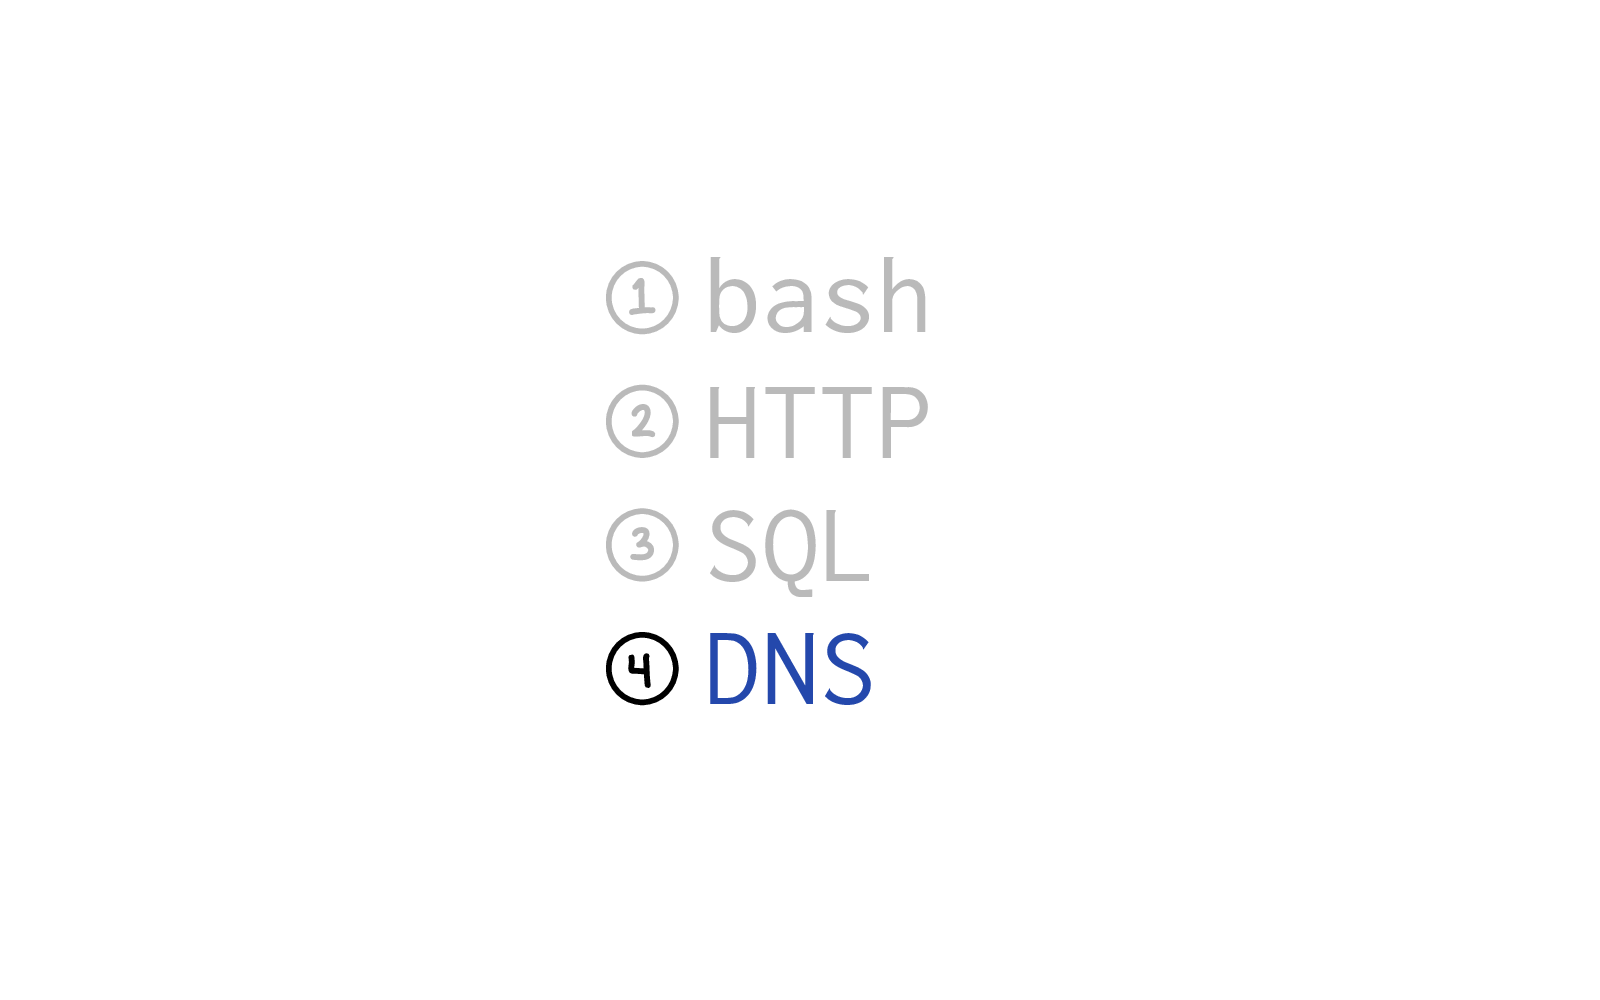
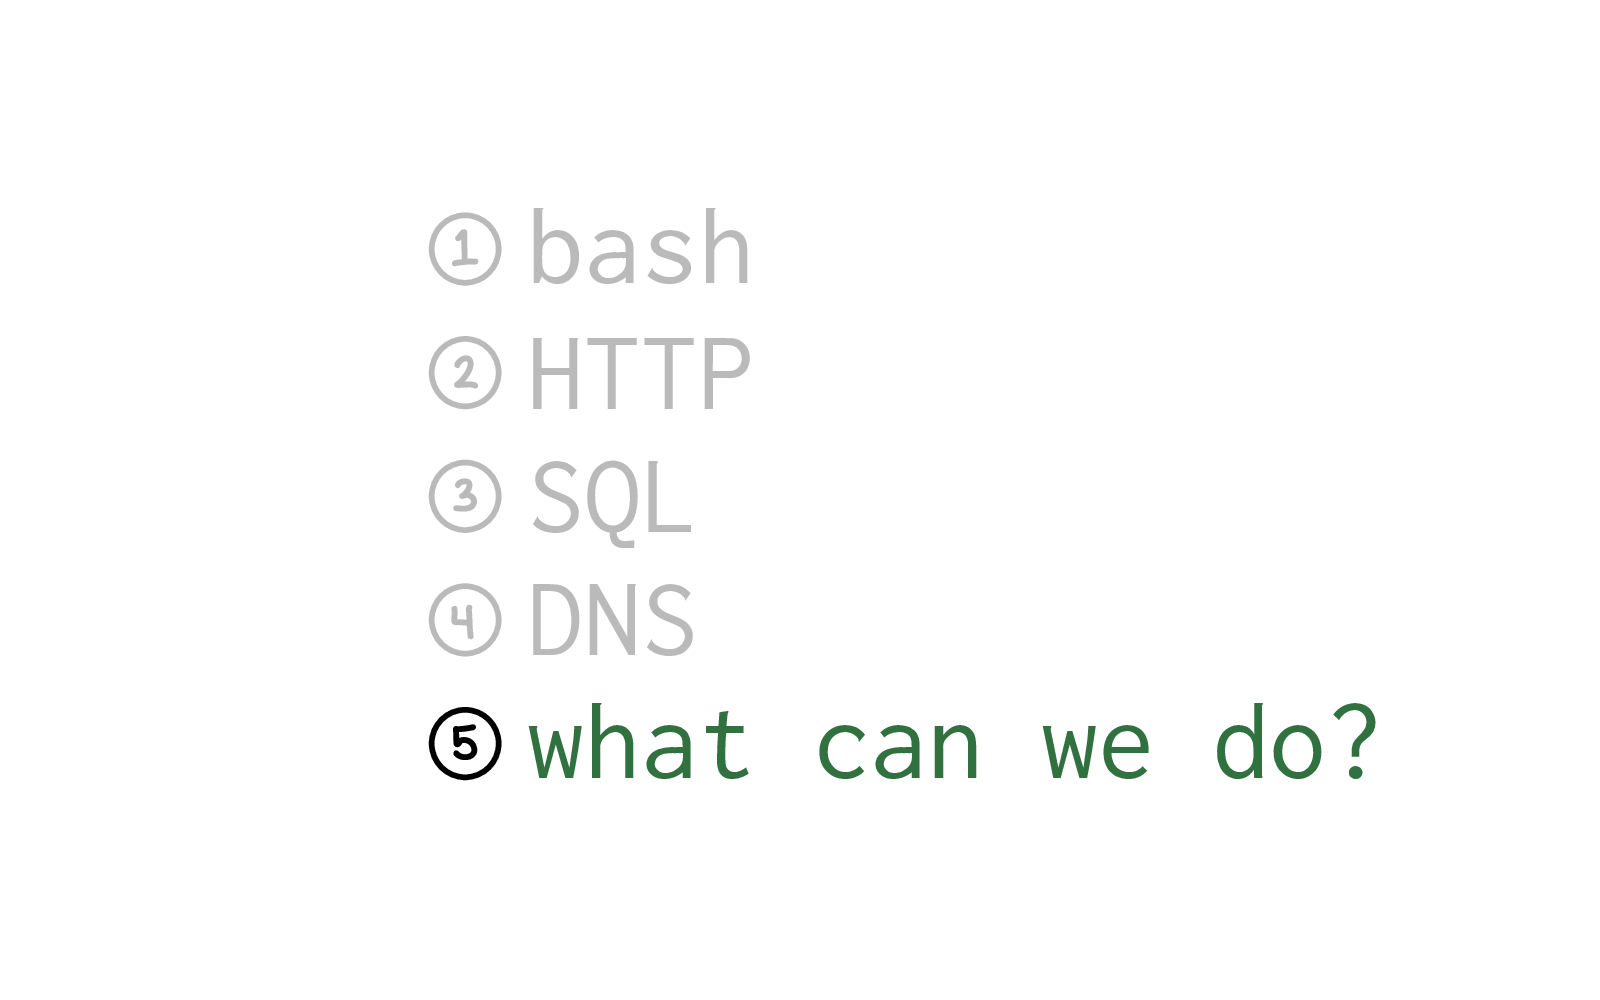
We're going to talk about bash, HTTP, SQL, and DNS.
For each of them, we're going to talk a little bit about:
a. what's so hard about it?
b. what are some things we can do to make it a little bit easier for each other?

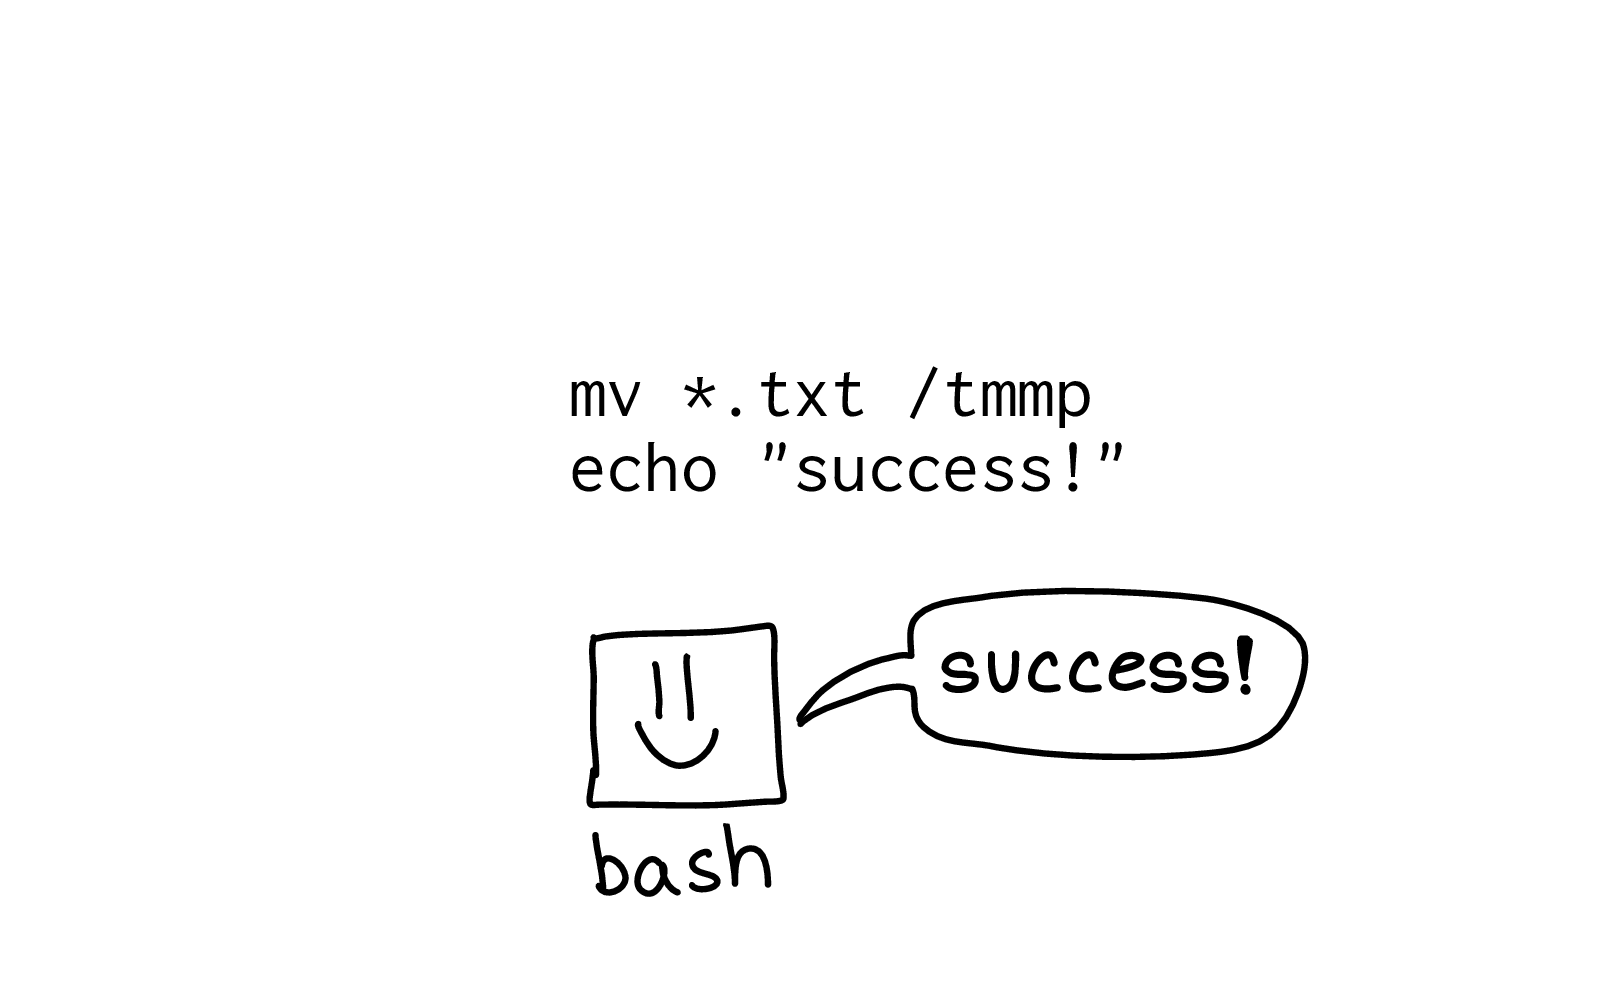
First, let's run this script, bad.sh:
mv ./*.txt /tmmpp
echo "success!"
This moves a file and prints "success!". And with most of the programming languages that I use, if there's a problem, the program will stop.
[laughter from audience]
But I think a lot of you know from maybe sad experience that bash does not stop, right? It keeps going. And going... and sometimes very bad things happen to your computer in the process.
When I run this program, here's the output:
mv: cannot stat './*.txt': No such file or directory
success!
It didn't stop after the failed mv.
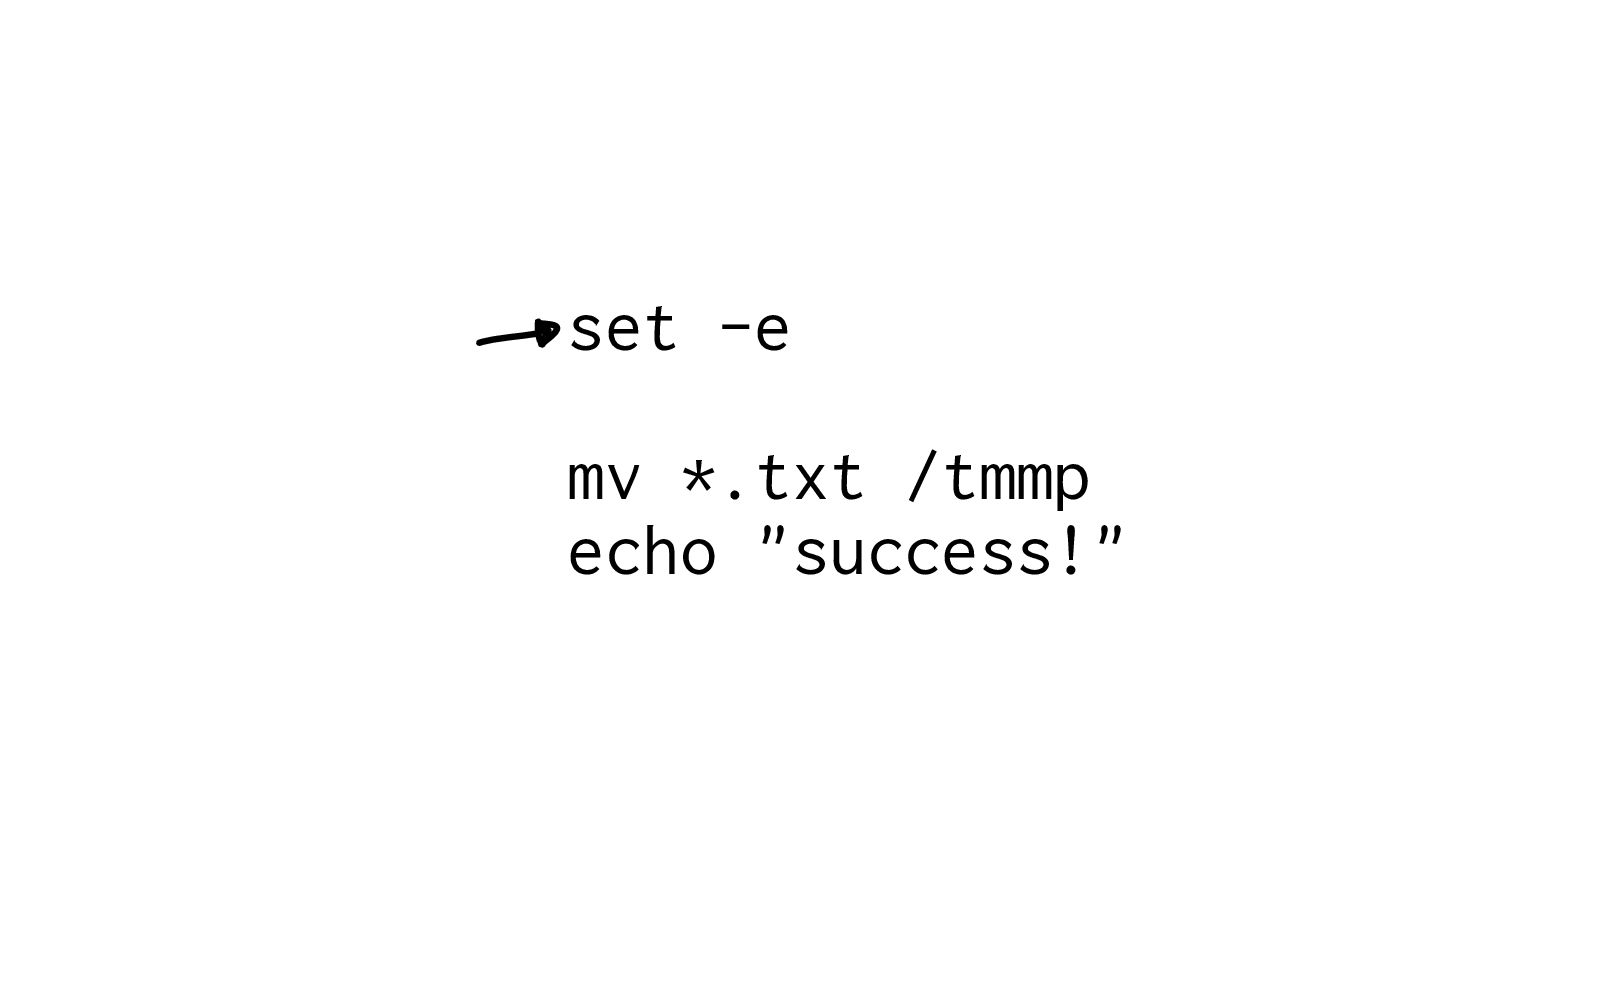
Eventually I learned that you can write set
-e at the top of your program, and that will make bash stop if
there's a problem.
When we run this new program with set -e at the top, here's the output:
mv: cannot stat './*.txt': No such file or directory
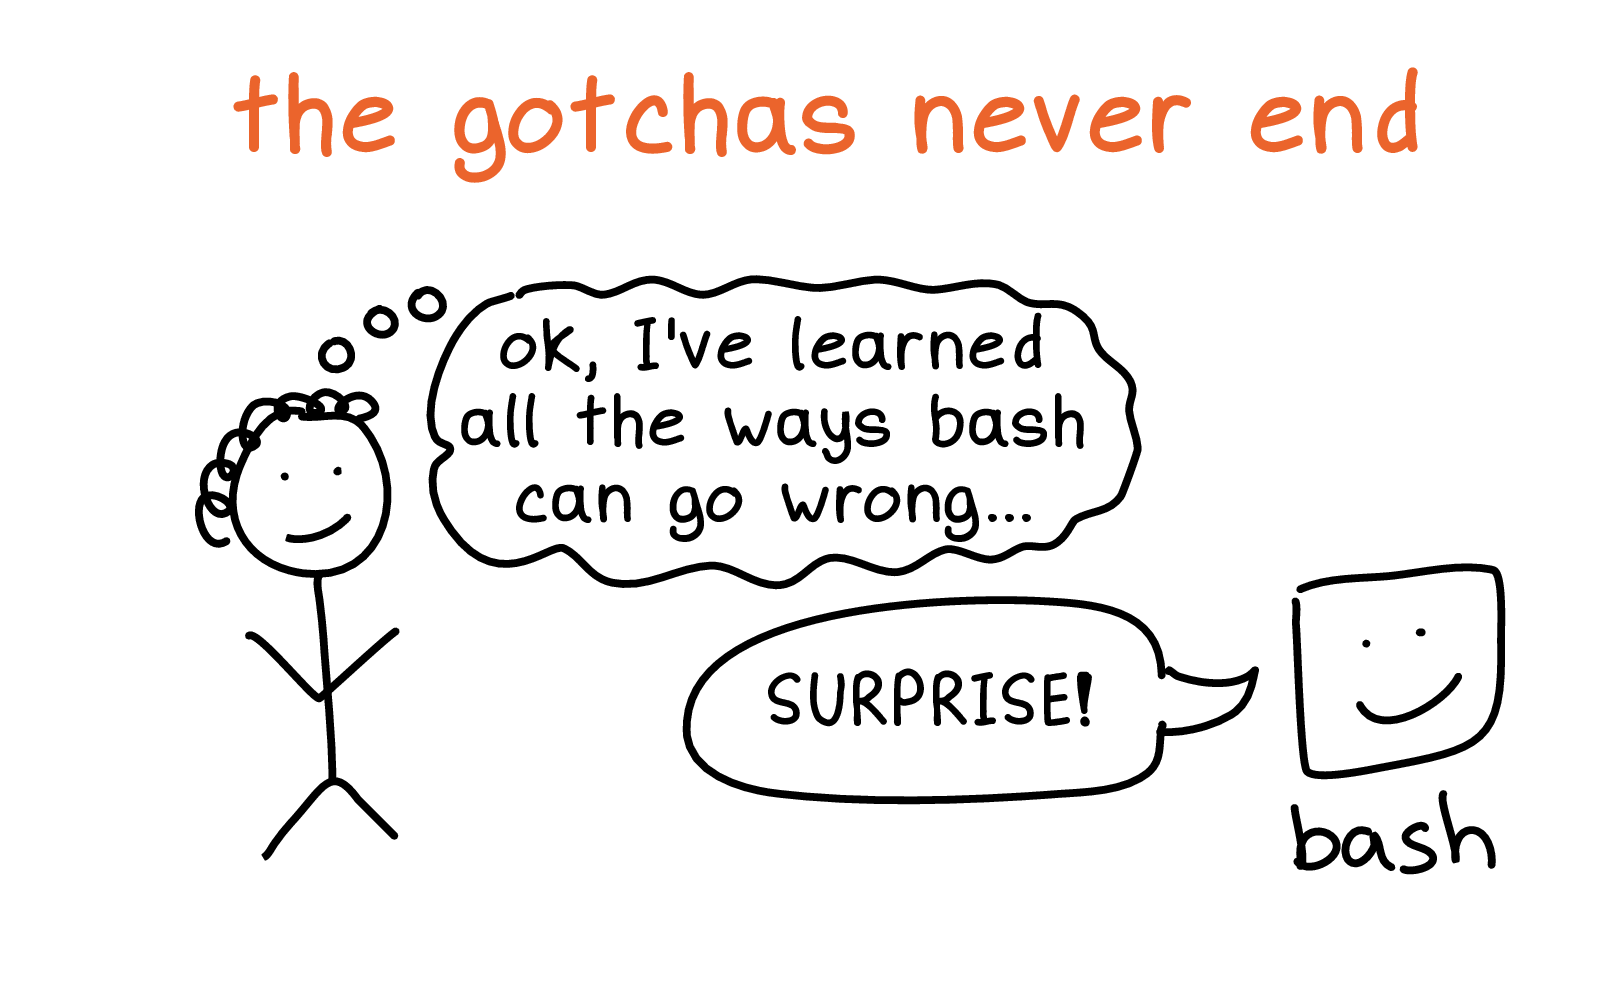
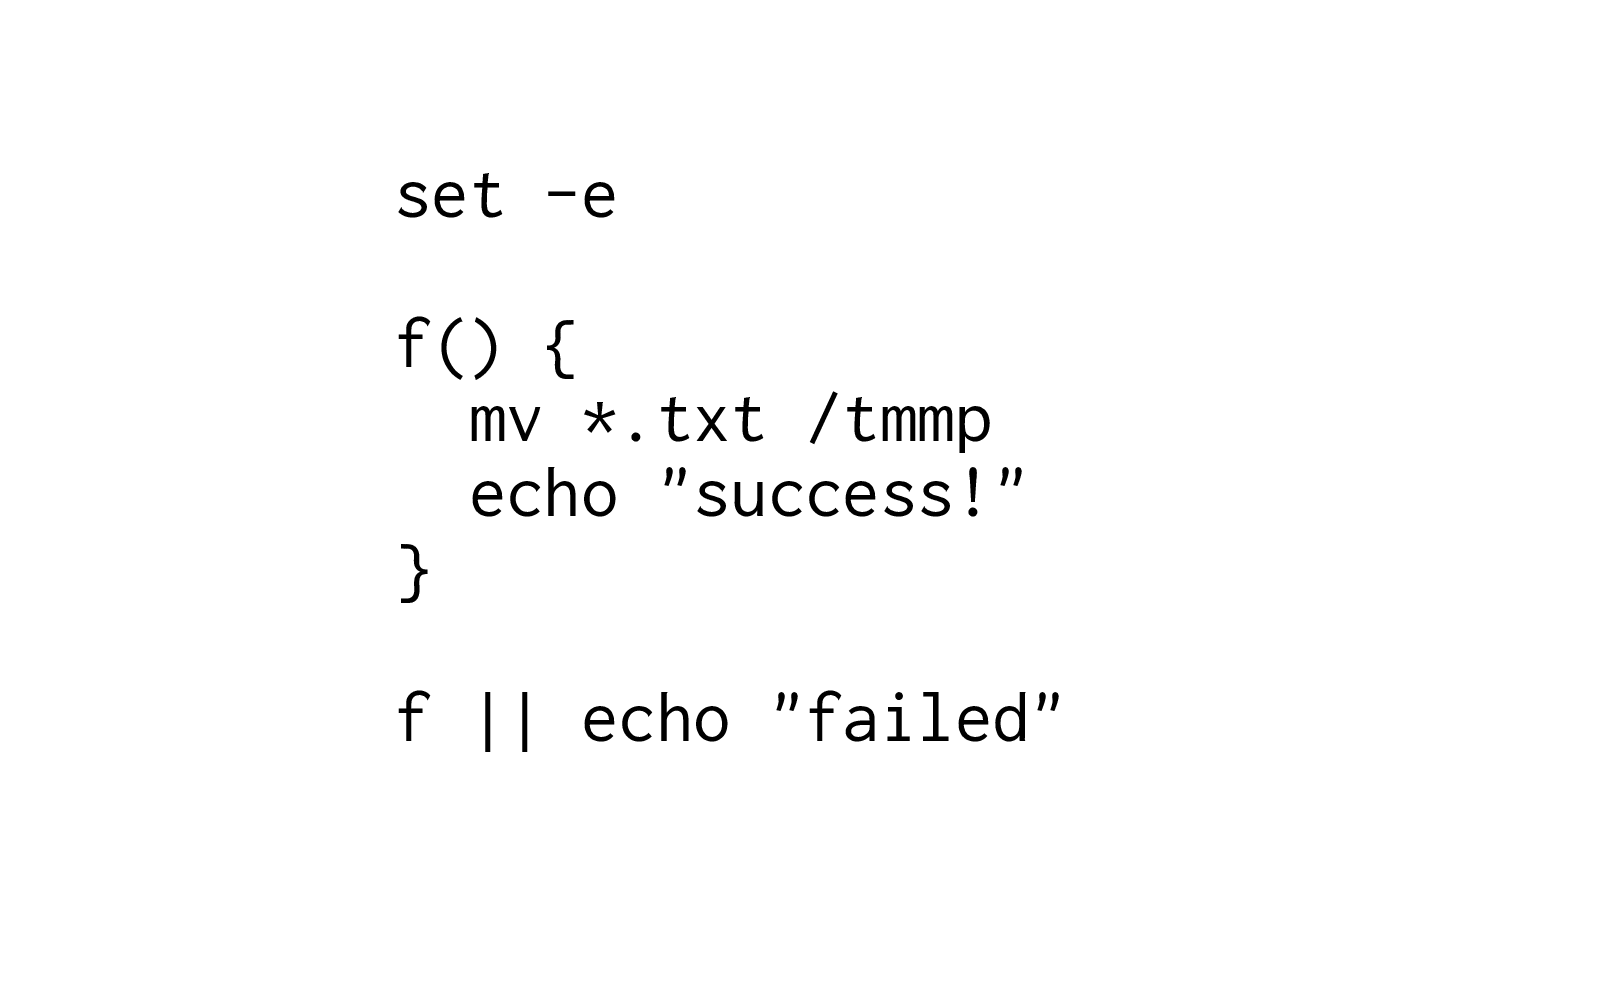
Here we've put our code in a function. And if the function fails, we want to echo "failed".
So use set -e at the beginning, and you might think everything should be okay.
But if we run it... this is the output we get
mv: cannot stat './*.txt': No such file or directory
success
We get the "success" message again! It didn't stop, it just kept going. This is
because the "or" (|| echo "failed") globally disables set -e in the
function.
Which is certainly not what I wanted, and not what I would expect. But this is not a bug in bash, it's is the documented behavior.
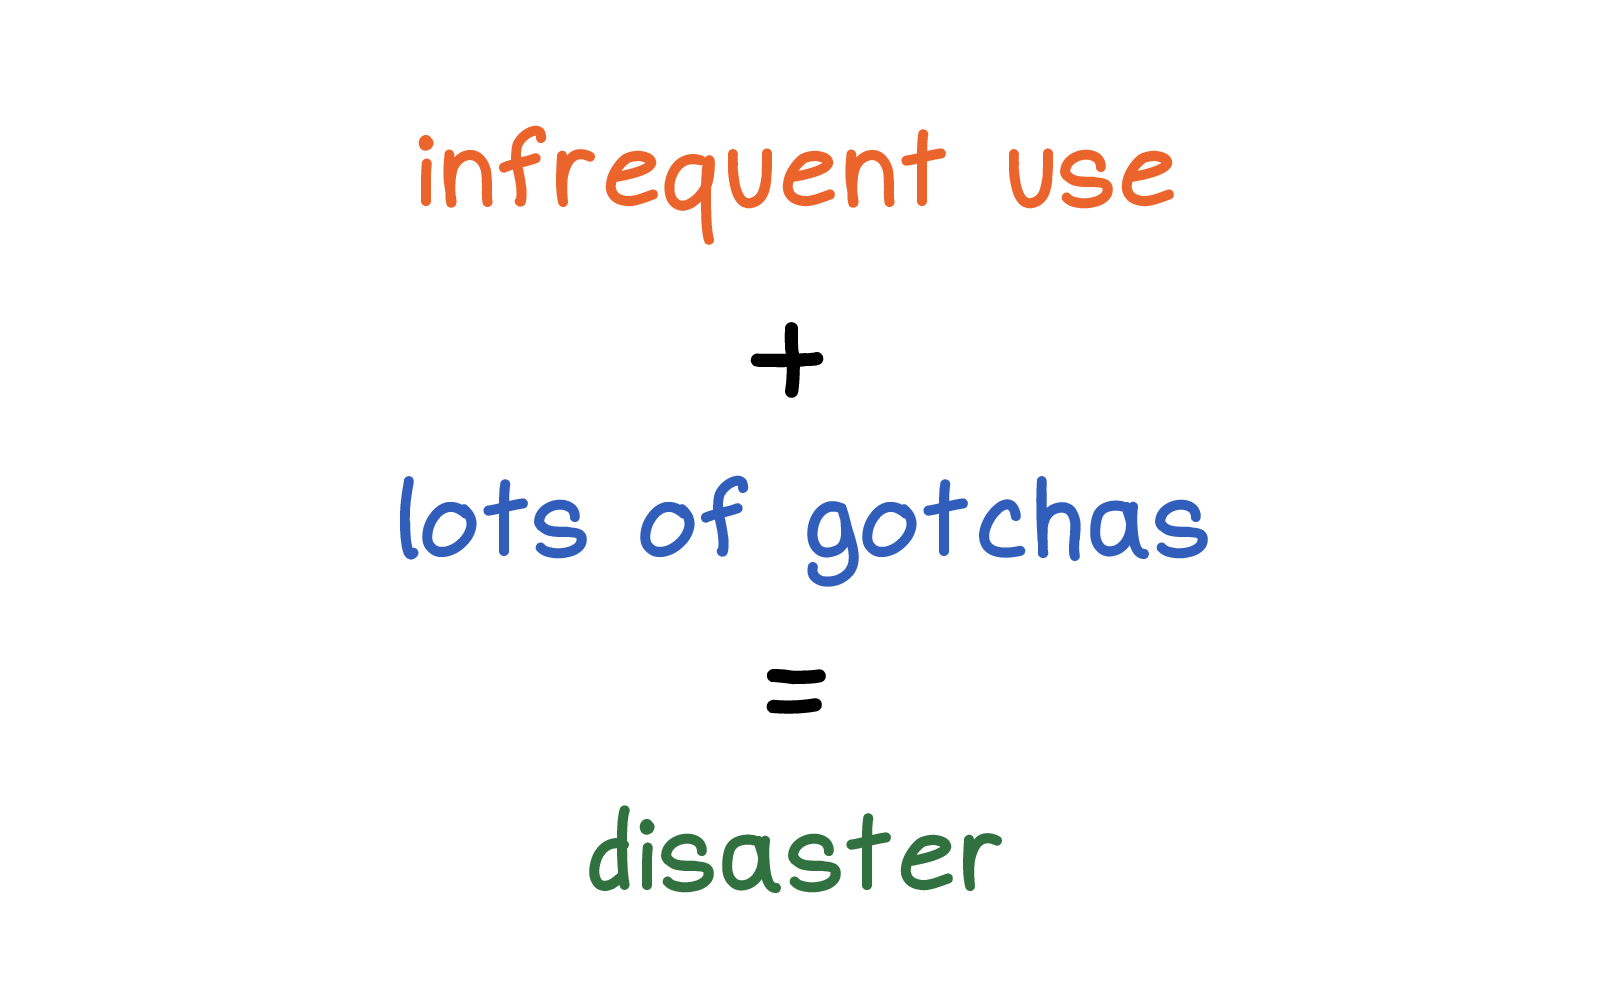
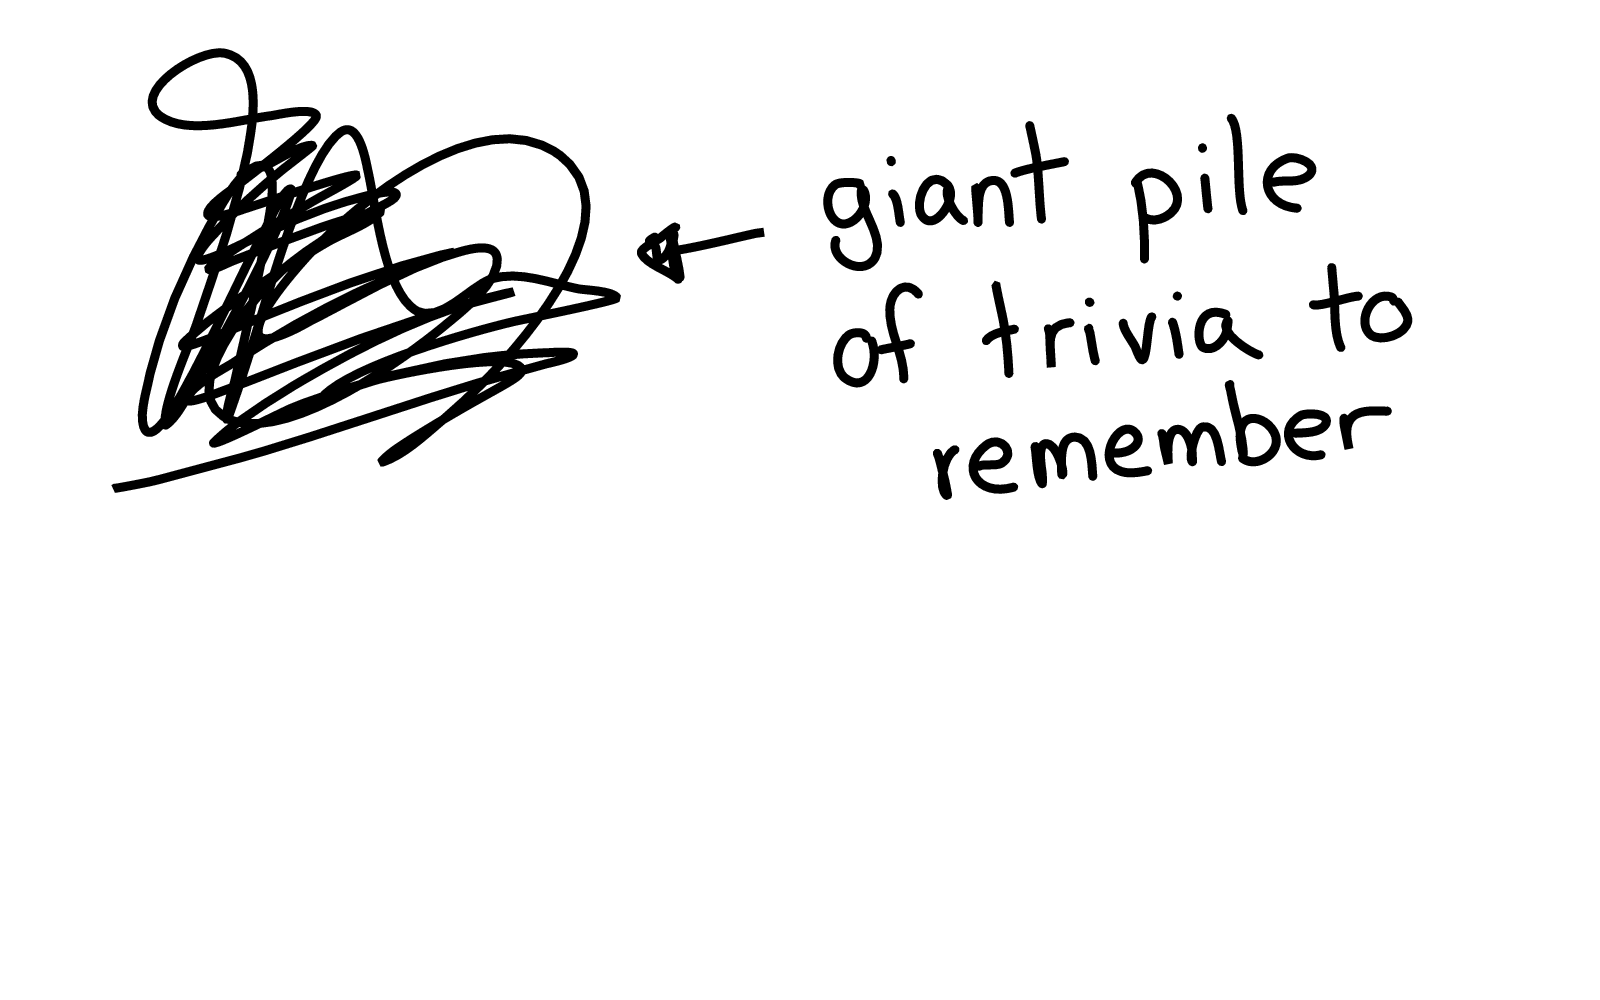
And I think one reason this is tricky is a lot of us don't use bash very often. Maybe you write a bash script every six months and don't look at it again.
When you use a system very infrequently and it's full of a lot of weird trivia and gotchas, it's hard to use the system correctly.


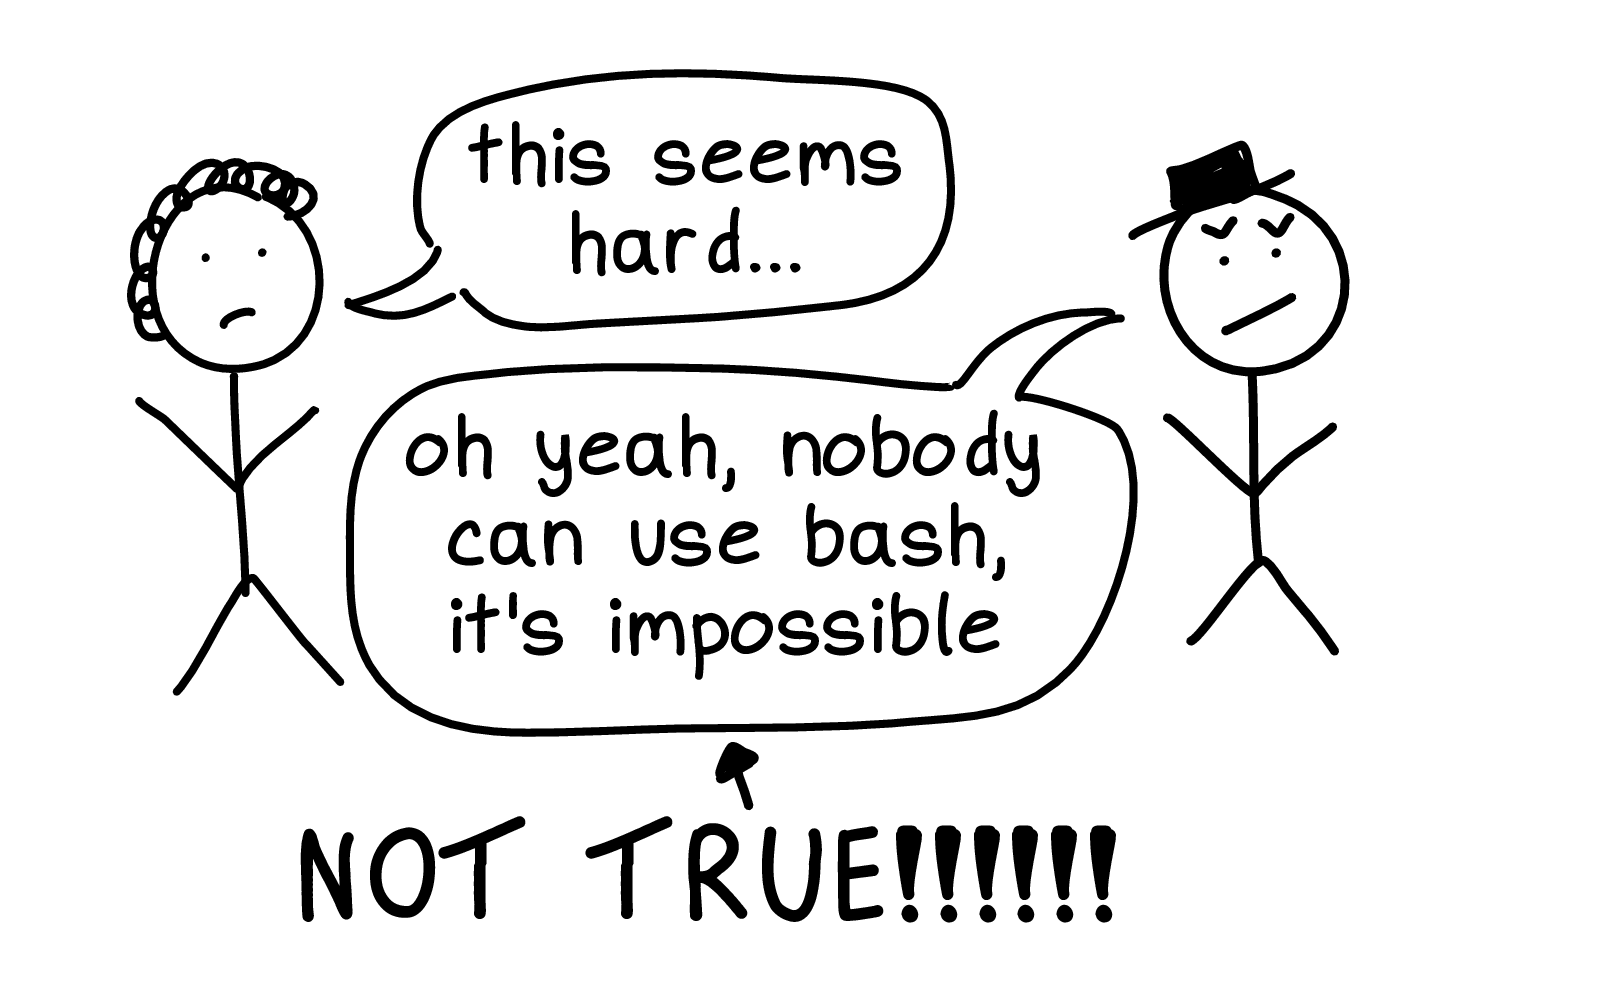
But I would say this is factually untrue. How many of you are using bash?
A lot of us ARE using it! And it doesn't always work perfectly, but often it gets the job done.


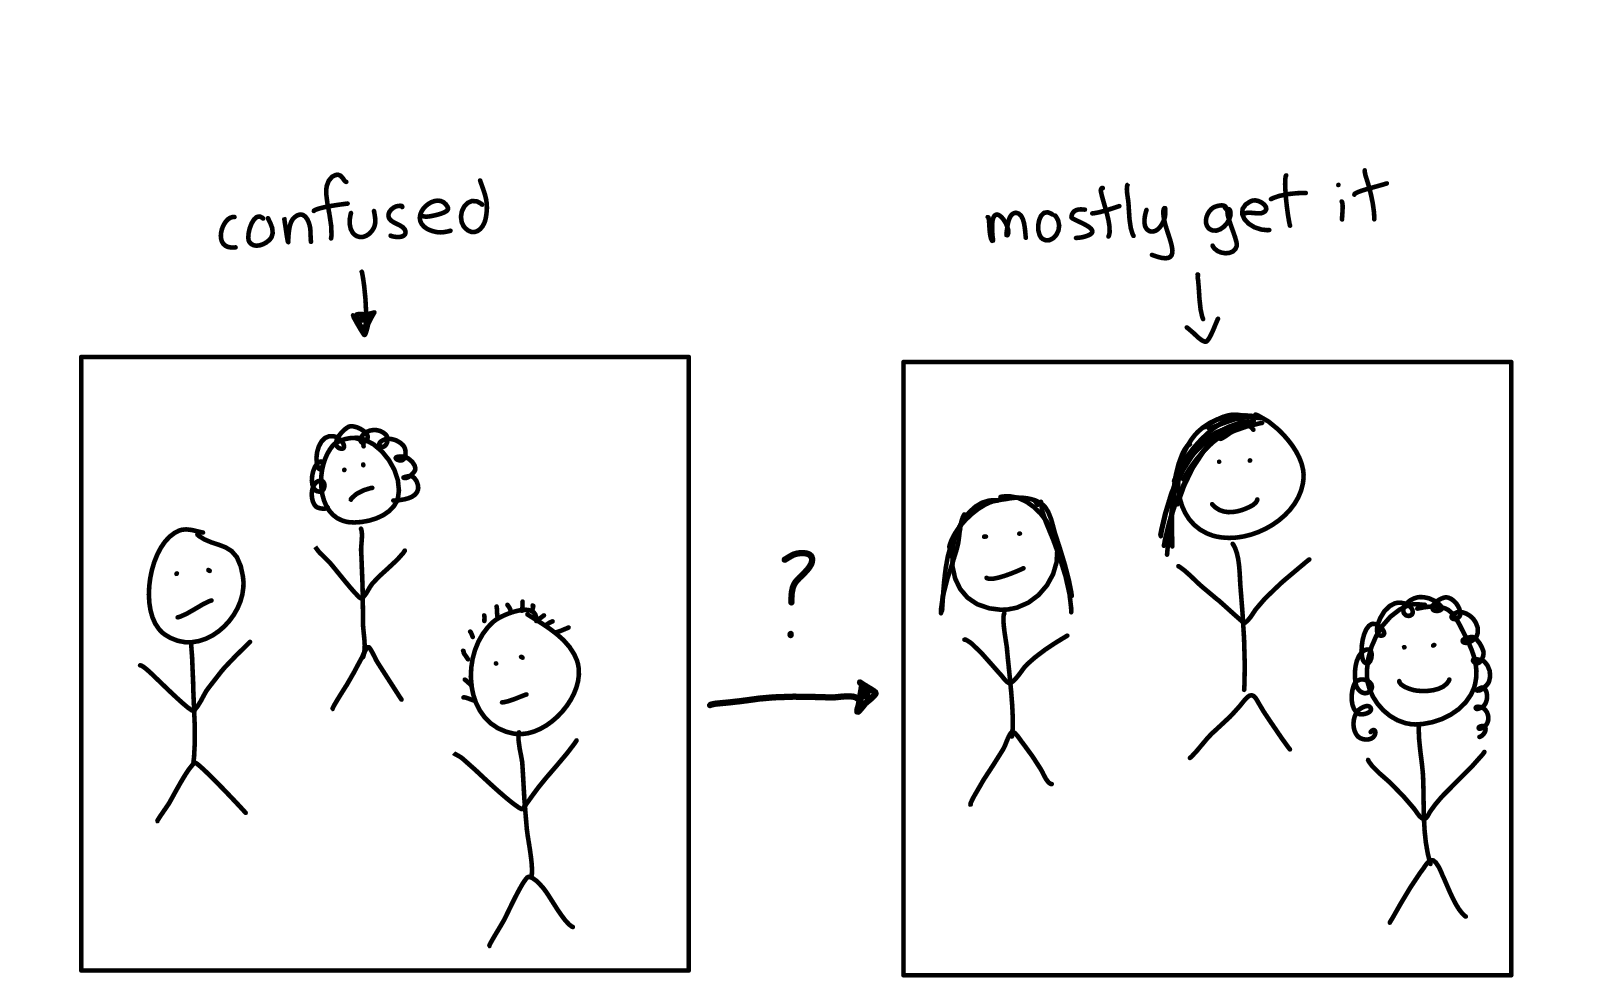
The way I think this is -- you have some people on the left in this diagram who are confused about bash, who think it seems awful and incomprehensible.
And some people on the right who know how to make the bash work for them, mostly.
So how do we move people from the left to the right, from being overwhelmed by a pile of impossible gotchas to being able to mostly use the system correctly?


And for bash, we have this incredible tool called shellcheck.
[ Applause ]
Yes! Shellcheck is amazing! And shellcheck knows a lot of things that can go wrong and can tell you "oh no, you don't want to do that. You're going to have a bad time."
I'm very grateful for shellcheck, it makes it much easier for me to write tiny bash scripts from time to time.

Now let's do a shellcheck demo!
$ shellcheck -o all bad-again.sh
In bad-again.sh line 7:
f || echo "failed!"
^-- SC2310 (info): This function is invoked in an || condition so set -e will be disabled. Invoke separately if failures should cause the script to exit.
Shellcheck gives us this
lovely error message. The message isn't completely obvious on its own (and this
check is only run if you invoke shellcheck with -o all). But
shellcheck tells you "hey, there's this problem, maybe you should be worried
about that".
And I think it's wonderful that all these tips live in this linter.

I'm not trying to tell you to write linters, though I think that some of you probably will write linters because this is that kind of crowd.
I've personally never written a linter, and I'm definitely not going to create something as cool as shellcheck!

But instead, the way I write linters is I tell people about shellcheck from time to time and then I feel a little like I invented shellcheck for those people. Because some people didn't know about the tool until I told them about it!
I didn't find out about shellcheck for a long time and I was kind of mad about it when I found out. I felt like -- excuse me? I could have been using shellcheck this whole time? I didn't need to remember all of this stuff in my brain?
So I think an incredible thing we can do is to reflect on the tools that we're using to reduce our cognitive load and all the things that we can't fit into our minds, and make sure our friends or coworkers know about them.

I also like to warn people about gotchas and some of the terrible things computers have done to me.

I think this is an incredibly valuable community service. The example I shared
about how set -e got disabled is something I learned from my
friend Jesse a few weeks ago.
They told me how this thing happened to them, and now I know and I don't have to go through it personally.

One way I see people kind of trying to share terrible things that their computers have done to them is by sharing "best practices".
But I really love to hear the stories behind the best practices!
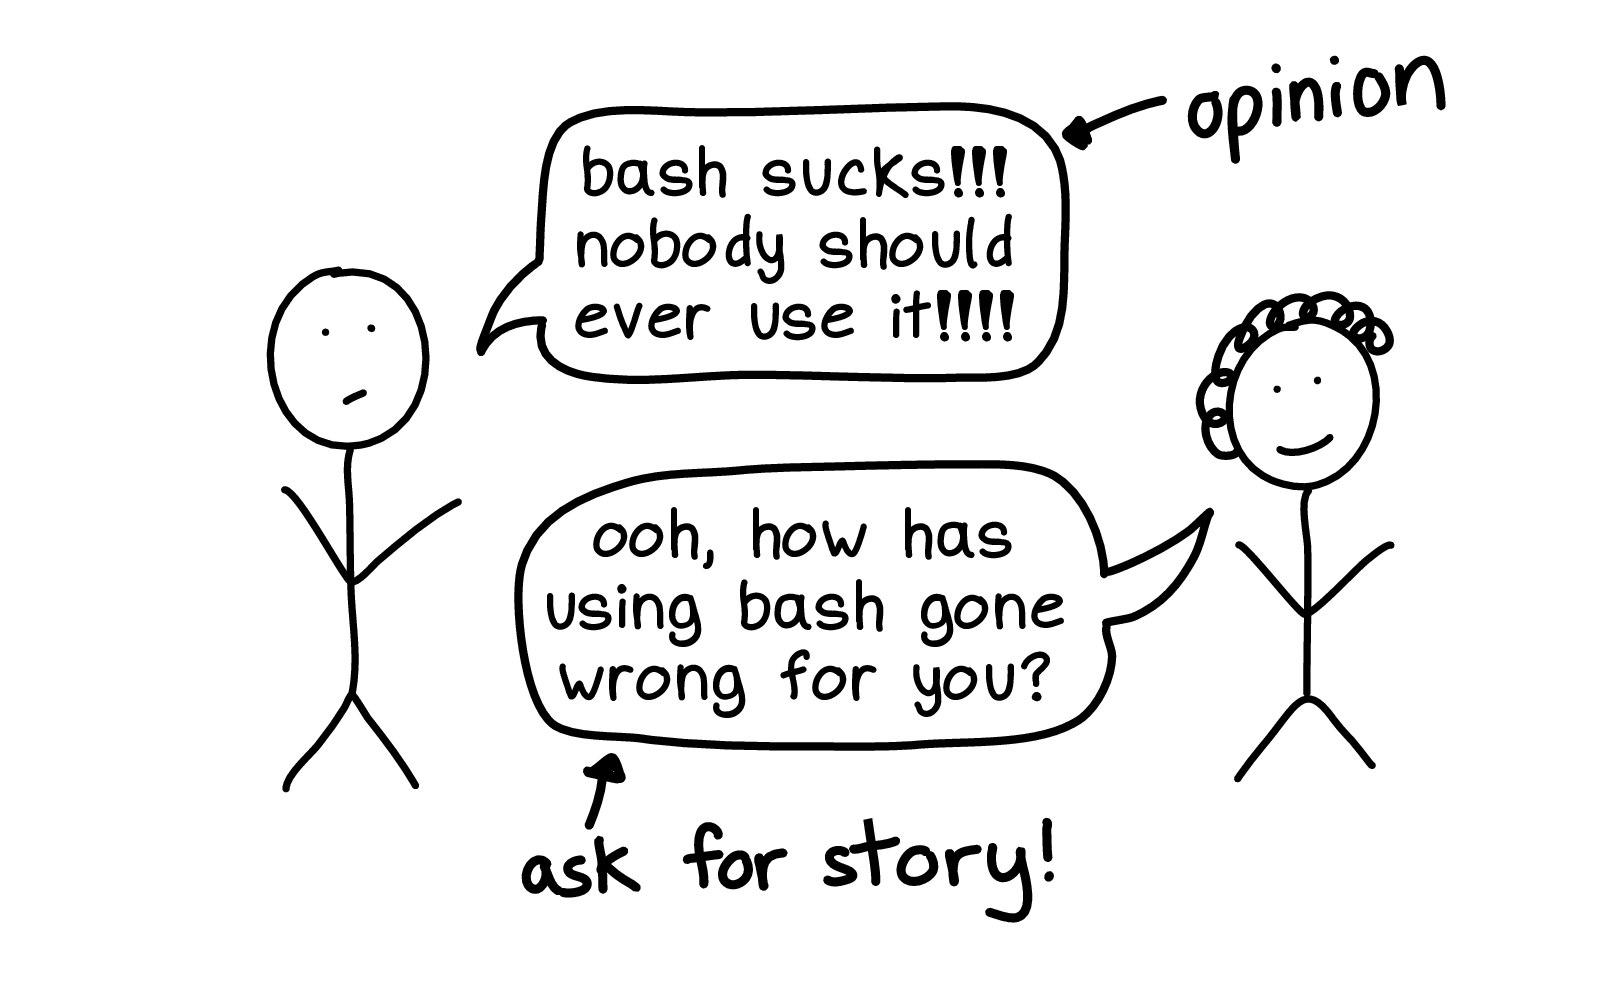
If someone has a strong opinion like "nobody should ever use bash", I want to hear about the story! What did bash do to you? I need to know.
The reason I prefer stories to best practices is if I know the story about how the bash hurt you, I can take that information and decide for myself how I want to proceed.
Maybe I feel like -- the computer did that to you? That's okay, I can deal with that problem, I don't mind.
Or I might instead feel like "oh no, I'm going to do the best practice you recommended, because I do not want that thing to happen to me".
These bash stories are a great example of that: my reaction to them is "okay, I'm going to keep using bash, I'll just use shellcheck and keep my bash scripts pretty simple". But other people see them and decide "wow, I never want to use bash for anything, that's awful, I hate it".
Different people have different reactions to the same stories and that's okay.


I was talking to Marco Rogers at some point, many years ago, and he mentioned some new developers he was working with were struggling with HTTP.
And at first, I was a little confused about this -- I didn't understand what was hard about HTTP.
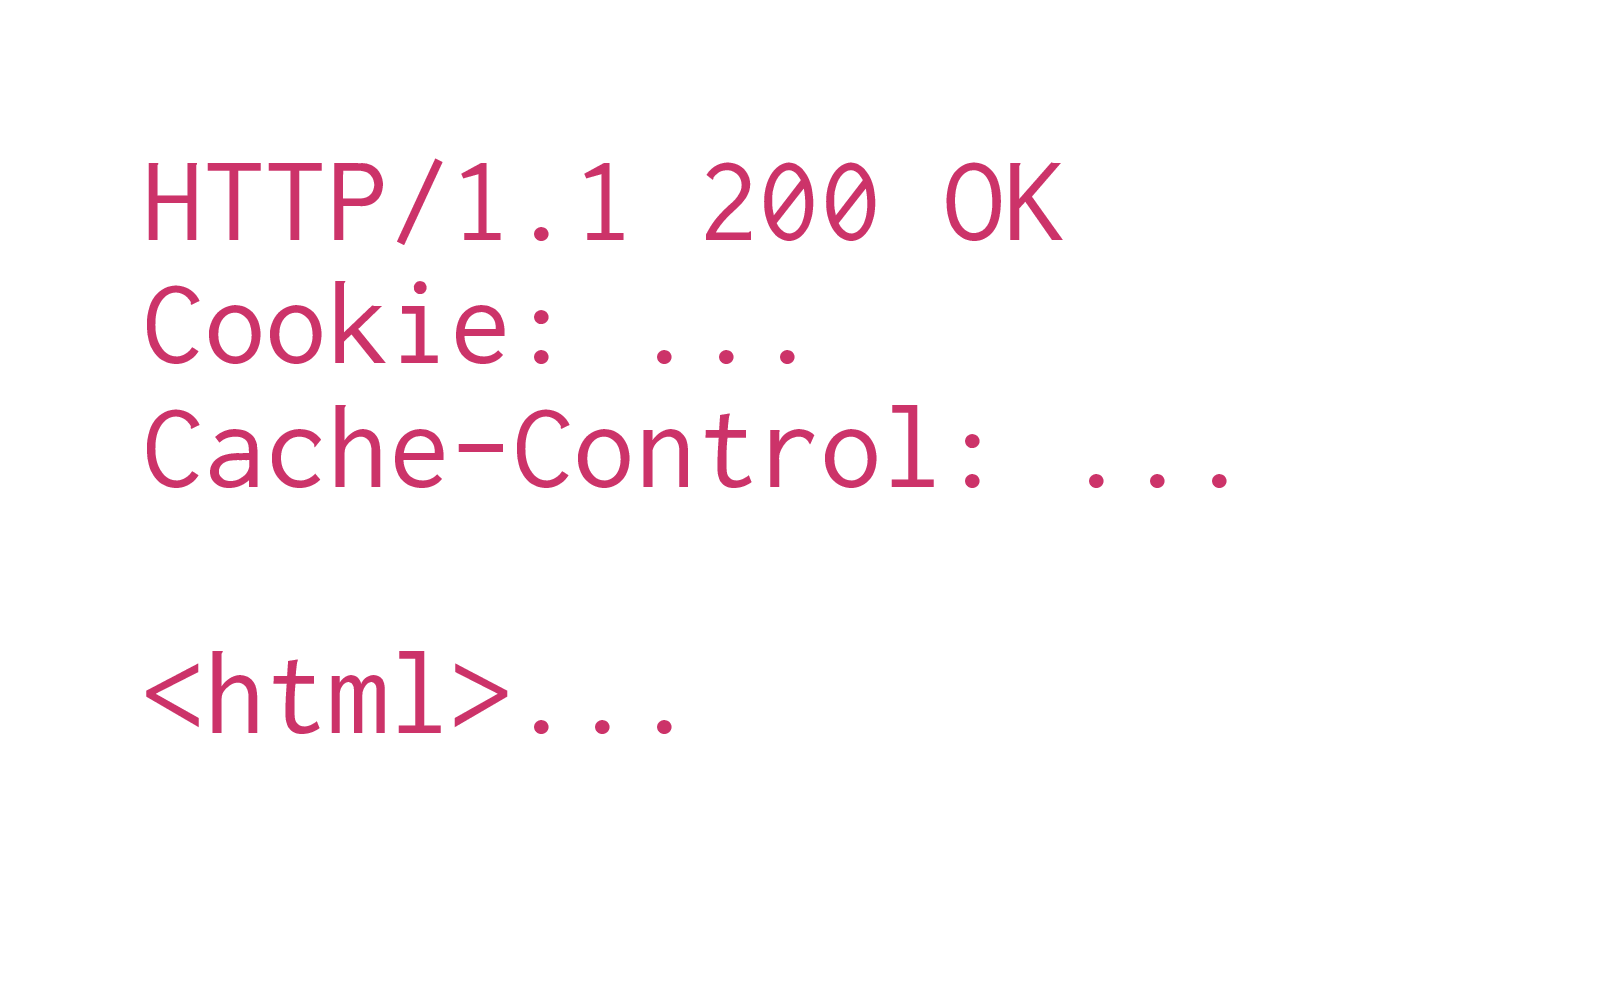
The way I was thinking about it at the time was that if you have an HTTP response, it has a few parts: a response code, some headers, and a body.
I felt like -- that's a pretty simple structure, what's the problem? But of course there was a problem, I just couldn't see what it was at first.

So, I talked to a friend who was newer to HTTP. And they asked "why does it matter what headers you set?"
And I said: "well, the browser..."


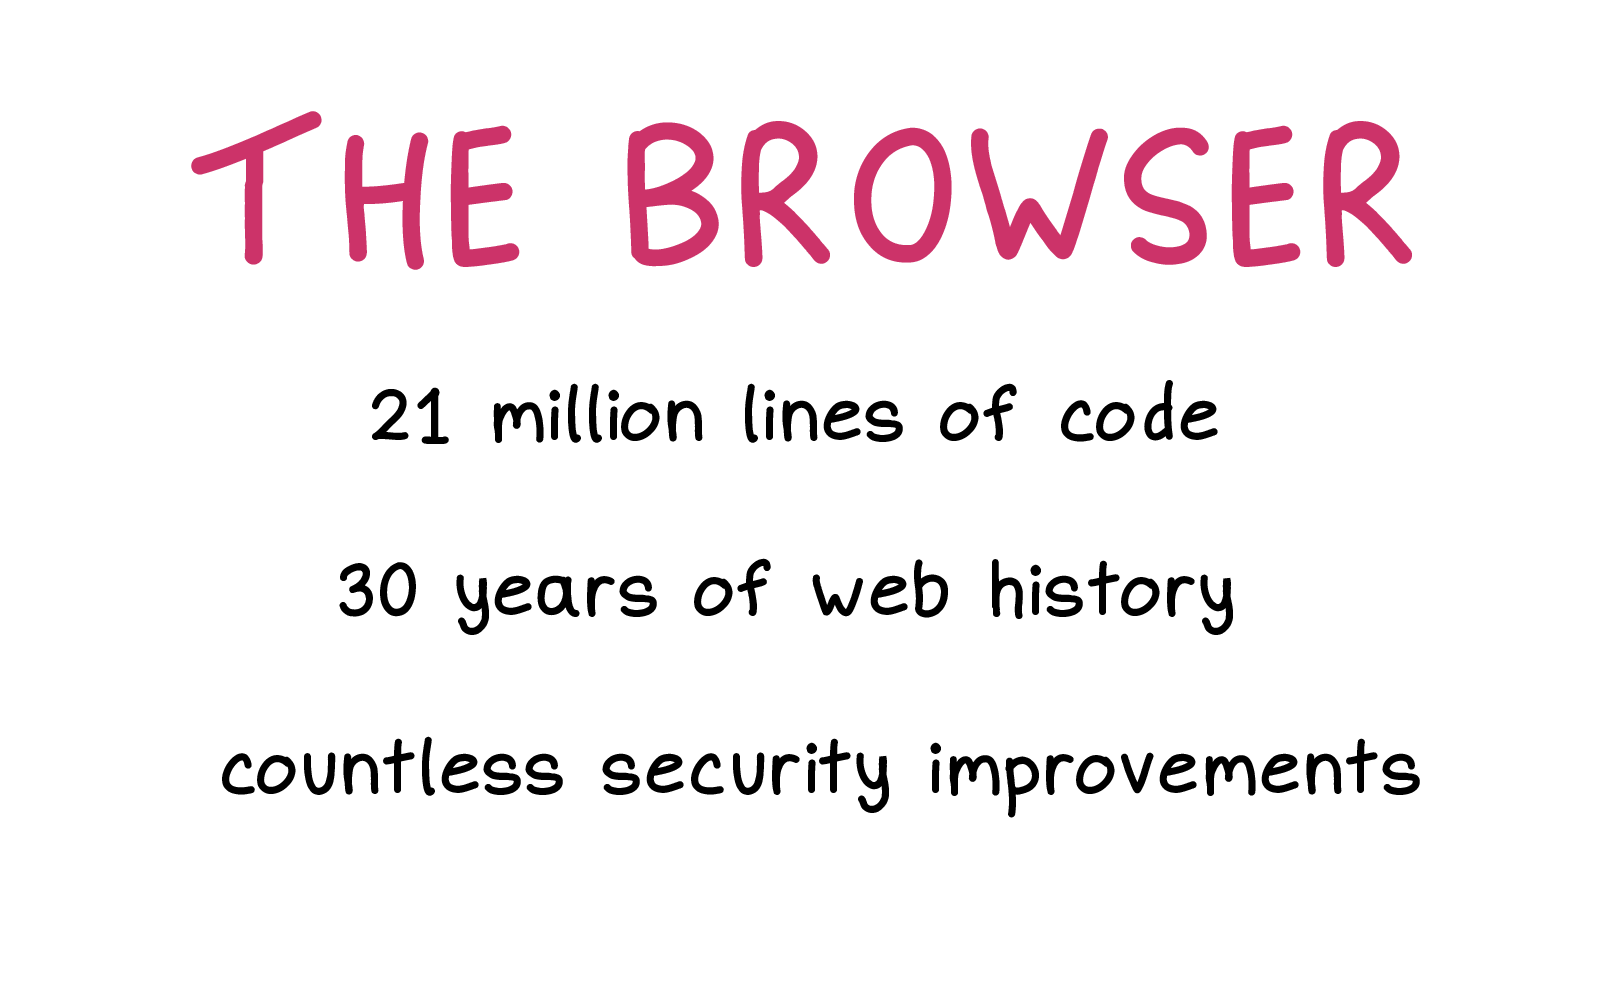
The browser!
Firefox is 20 million lines of code! It's been evolving since the '90s. There have been as I understand it, 1 million changes to the browser security model as people have discovered new and exciting exploits and the web has become a scarier and scarier place.
The browser is really a lot to understand.

One trick for understanding why a topic is hard is -- if the implementation if the thing involves 20 million lines of code, maybe that's why people are confused!
Though that 20 million lines of code also involves CSS and JS and many other things that aren't HTTP, but still.

Once I thought of it in terms of how complex a modern web browser is, it made so much more sense! Of course newcomers are confused about HTTP if you have to understand what the browser is doing!
Then my problem changed from "why is this hard?" to "how do I explain this at all?"
So how do we make it easier? How do we wrap our minds around this 20 million lines of code?
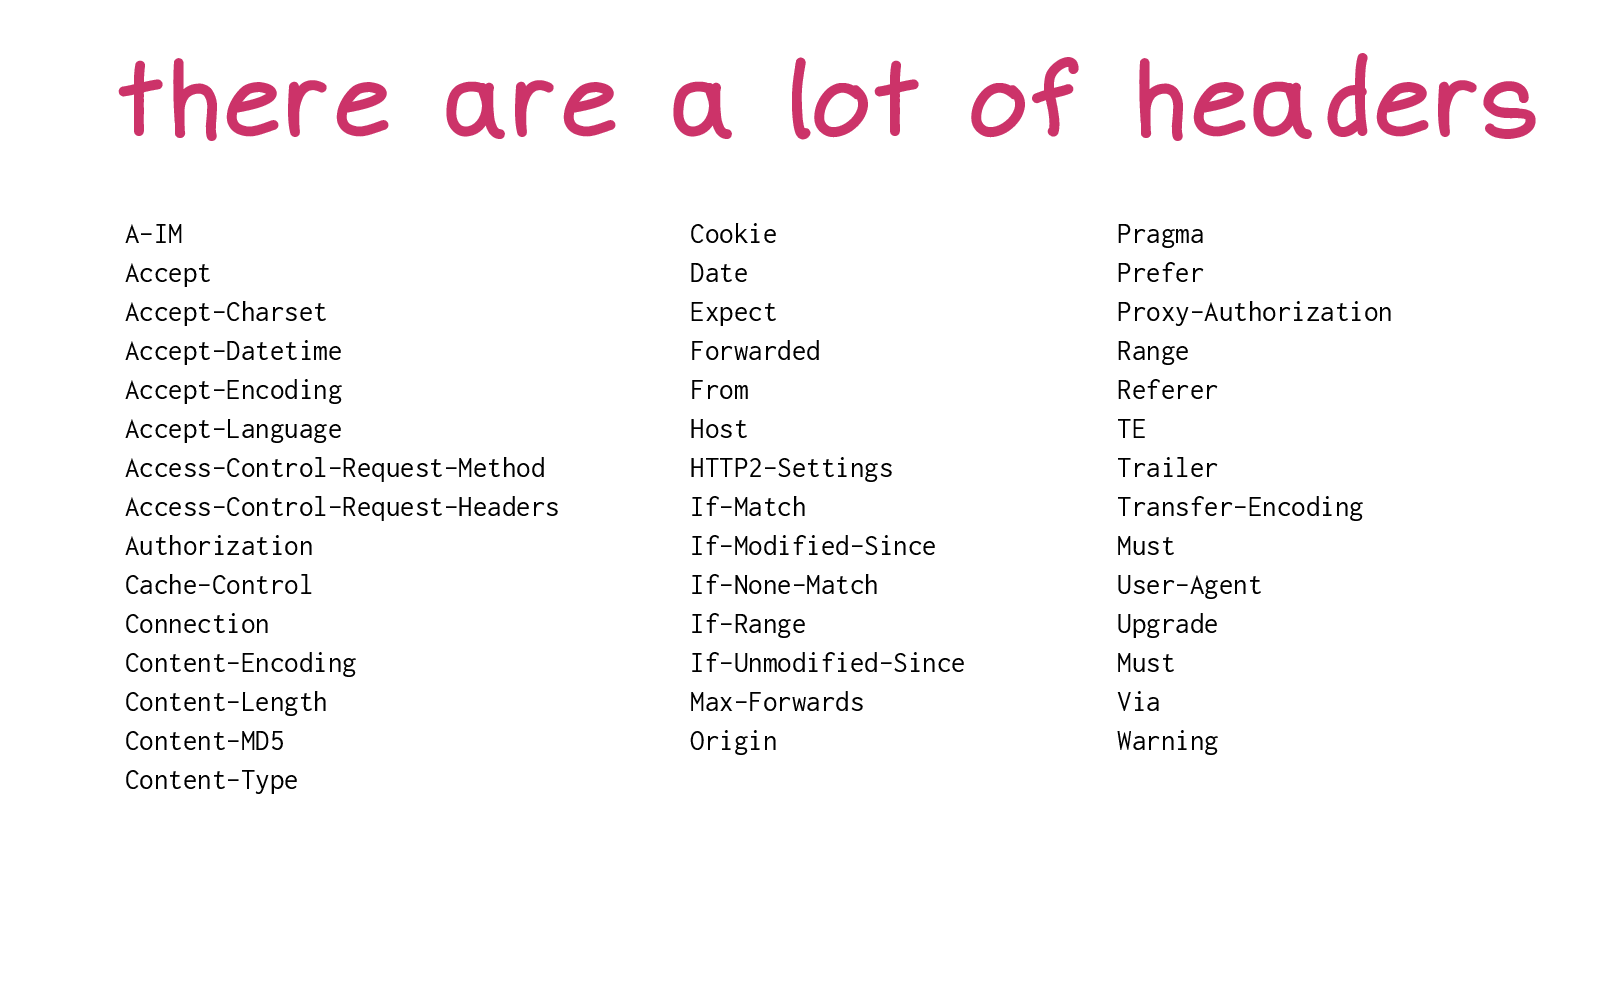
One way I think about this for HTTP is: here are some of the HTTP request headers. That's kind of a big list there are 43 headers there.
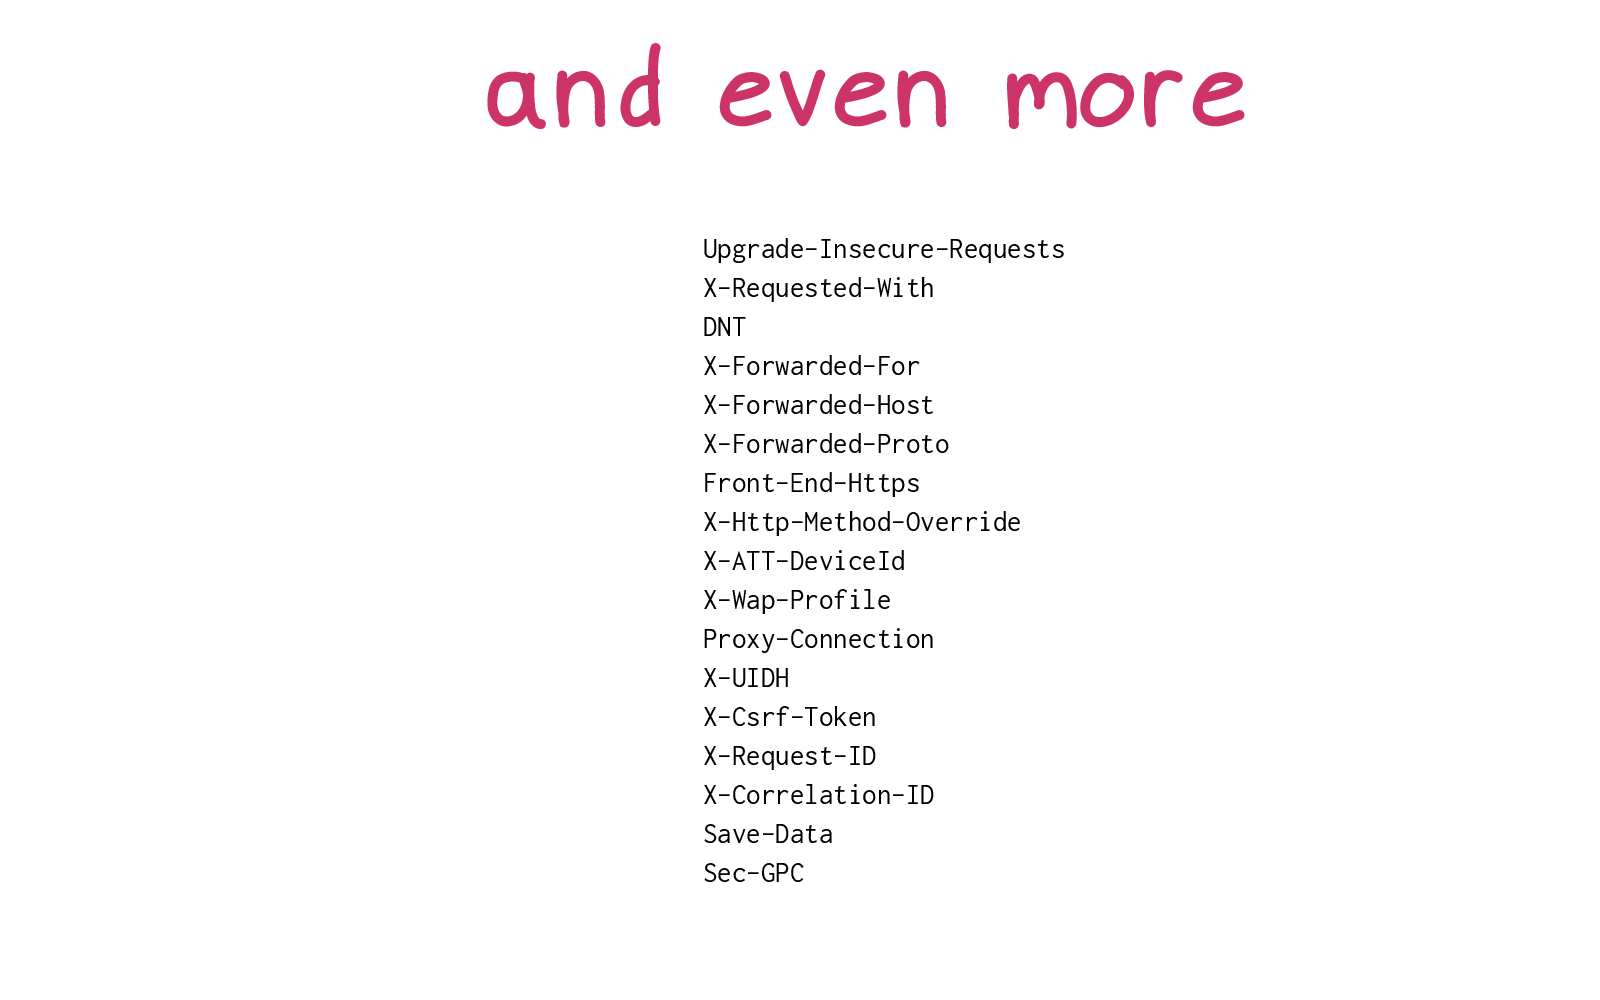
There are more unofficial headers too.

My brain does not contain all of those headers, I have no idea what most of them are.
When I think about trying to explain big topics, I think about -- what is actually in my brain, which only contains a normal human number of things?
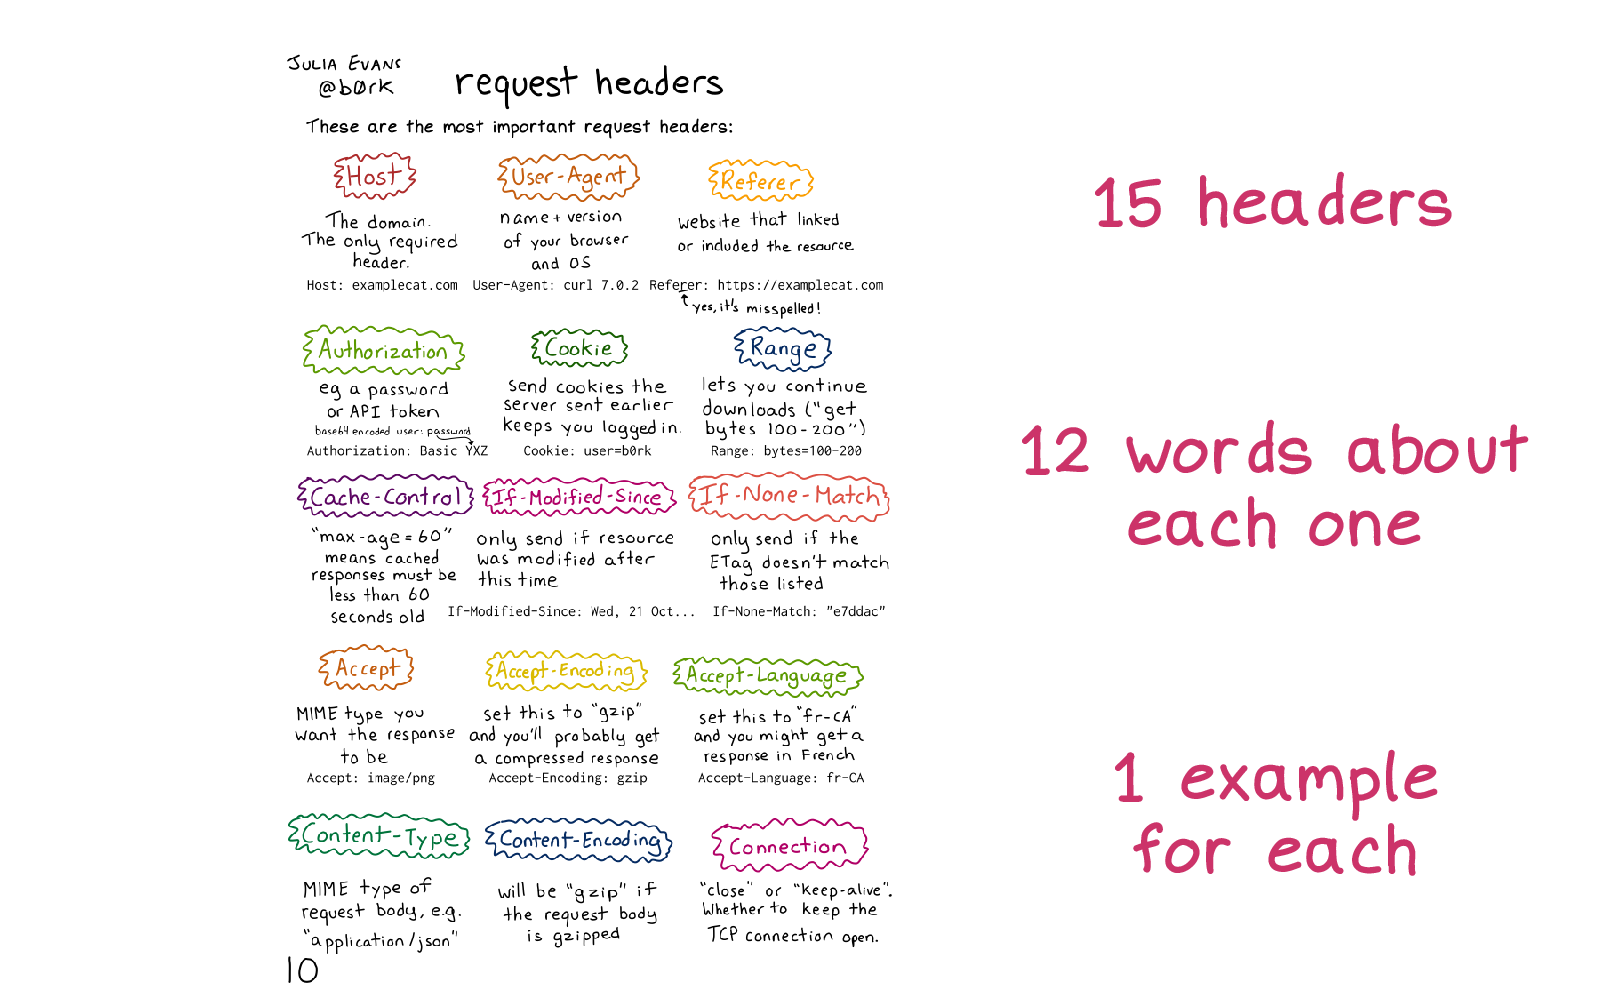
This is a comic I drew about HTTP request headers. You don't have to read the whole thing. This has 15 request headers.
I wrote that these are "the most important headers", but what I mean by "most important" here is that these are the ones that I know about and use. It's a subjective list.
I wrote about 12 words about each one, which I think is approximately the amount of information about each header that lives in my mind.
For example I know that you can set Accept-Encoding to gzip
and then you might get back a compressed response. That's all I know,
and that's usually all I need to know!
This very small set of information is working pretty well for me.
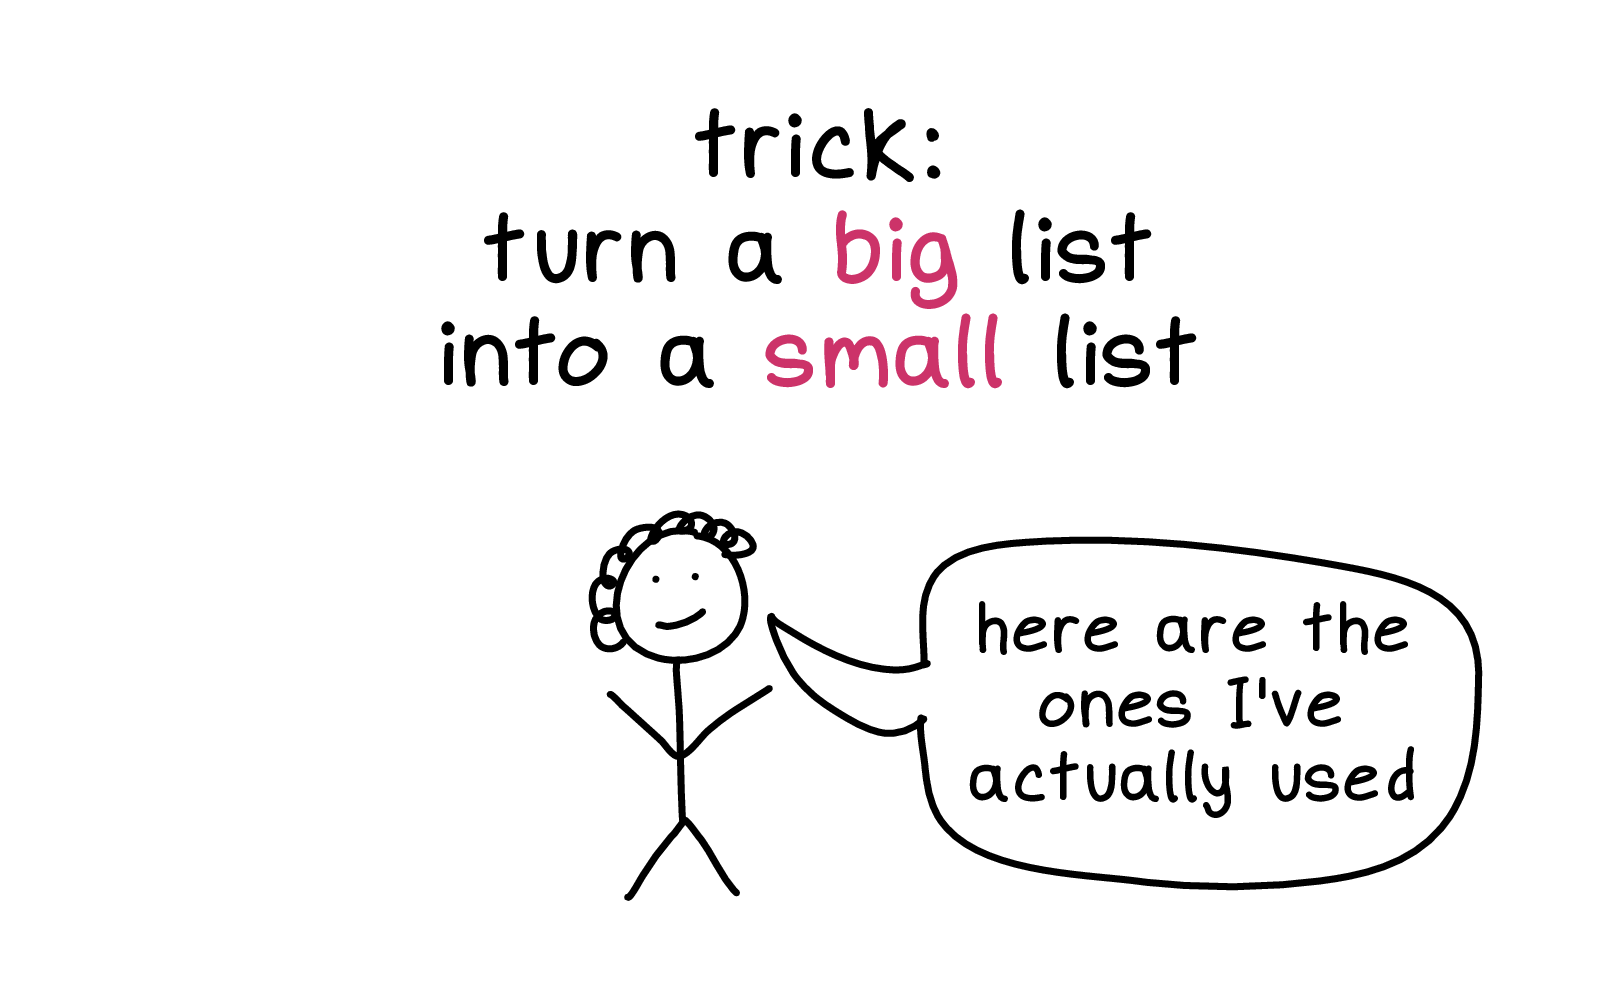
The general way I think about this trick is "turn a big list into a small list".
Turn the set of EVERY SINGLE THING into just the things I've personally used. I find it helps a lot.
Another example of this "turn a big list into a small list" trick is command line arguments.
I use a lot of command line tools, the number of arguments they have can be overwhelming, and I've written about them a fair amount over the years.
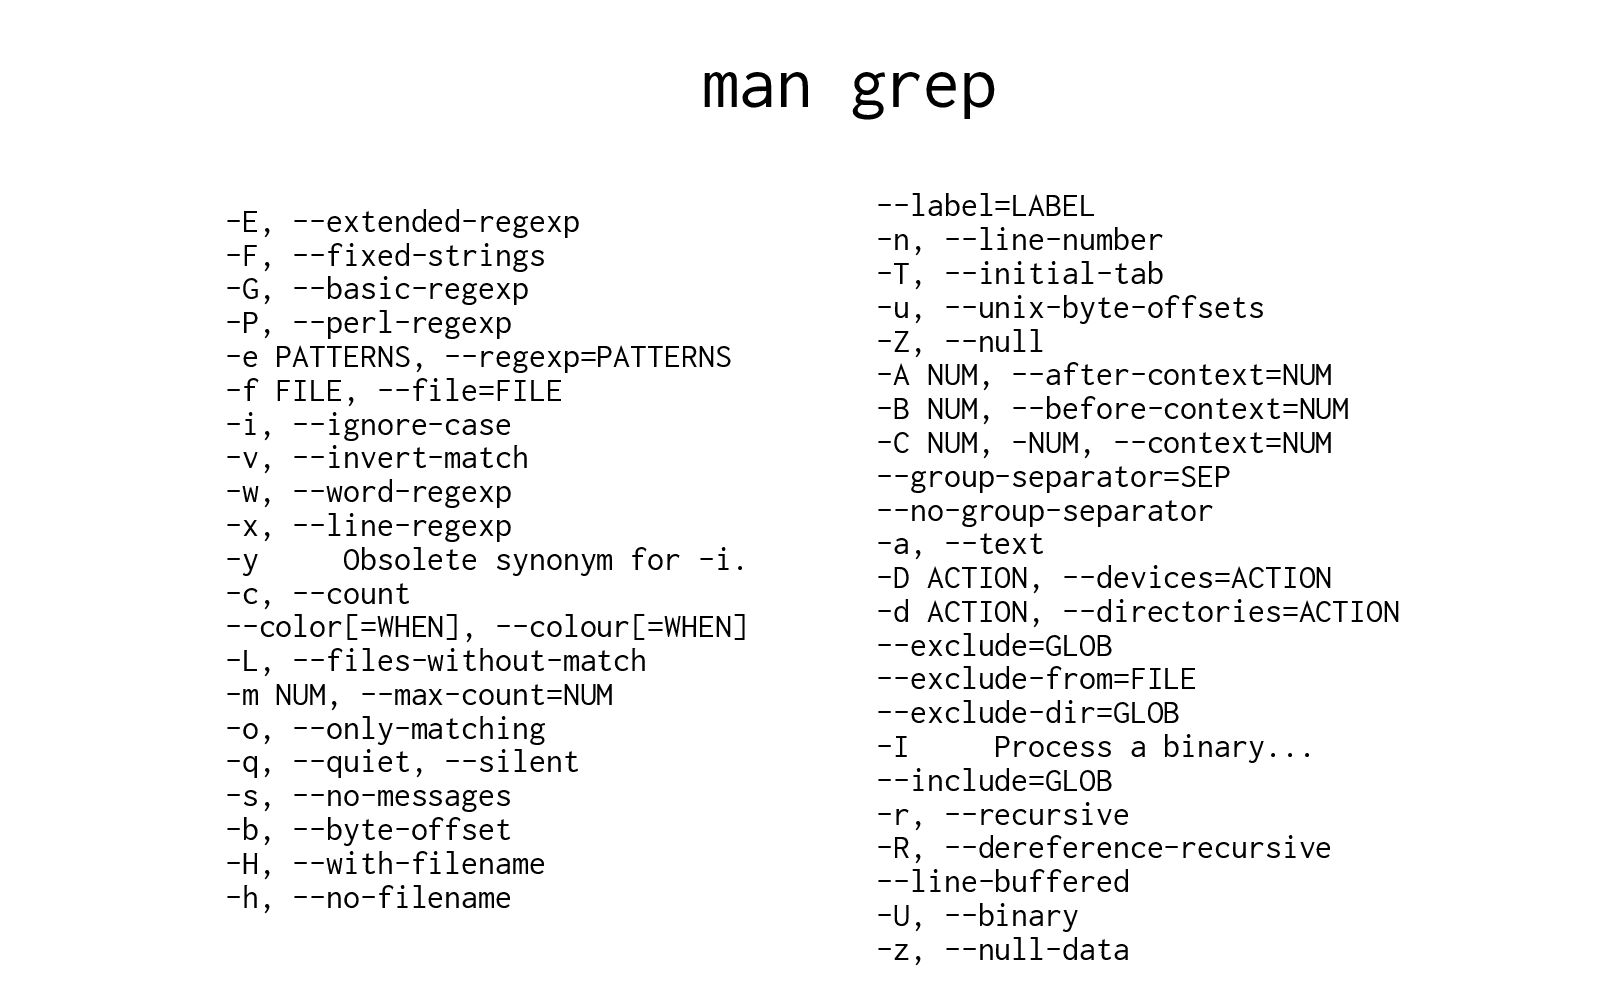
Here are all the flags for grep, from its man page. That's too much! I've been using grep for 20 years but I don't know what all that stuff is.
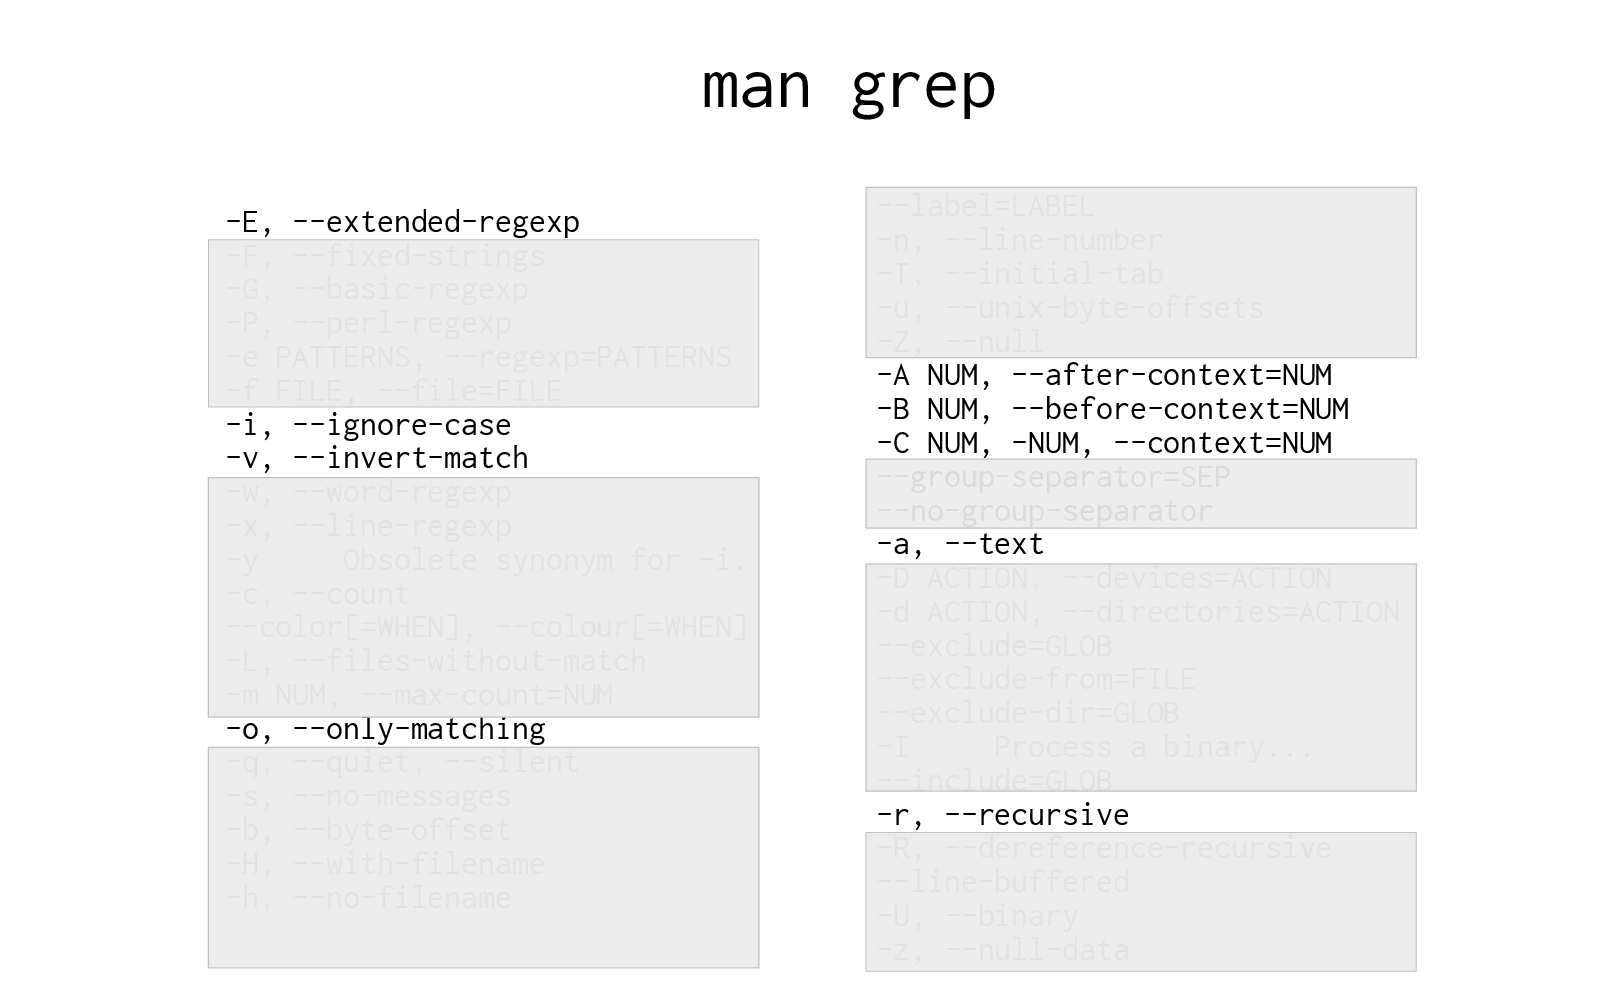
But when I look at the grep man page, this is what I see.
I think it's very helpful to newcomers when a more experienced person says "look, I've been using this system for a while, I know about 7 things about it, and here's what they are".
We're just pruning those lists down to a more human scale. And it can even help other more experienced people -- often someone else will know a slightly different set of 7 things from me.

But what about the stuff that doesn't fit in my brain?
Because I have a few things about HTTP stored in my brain. But sometimes I need other information which is hard to remember, like maybe the exact details of how CORS works.


I often have trouble finding the right references.
For example I've been trying to learn CSS off and on for 20 years. I've made a lot of progress -- it's going well!
But only in the last 2 years or so I learned about this wonderful website called CSS Tricks.
And I felt kind of mad when I learned about CSS Tricks! Why didn't I know about this before? It would have helped me!
But anyway, I'm happy to know about CSS Tricks now. (though sadly they seem to have stopped publishing in April after the acquisition, I'm still happy the older posts are there)
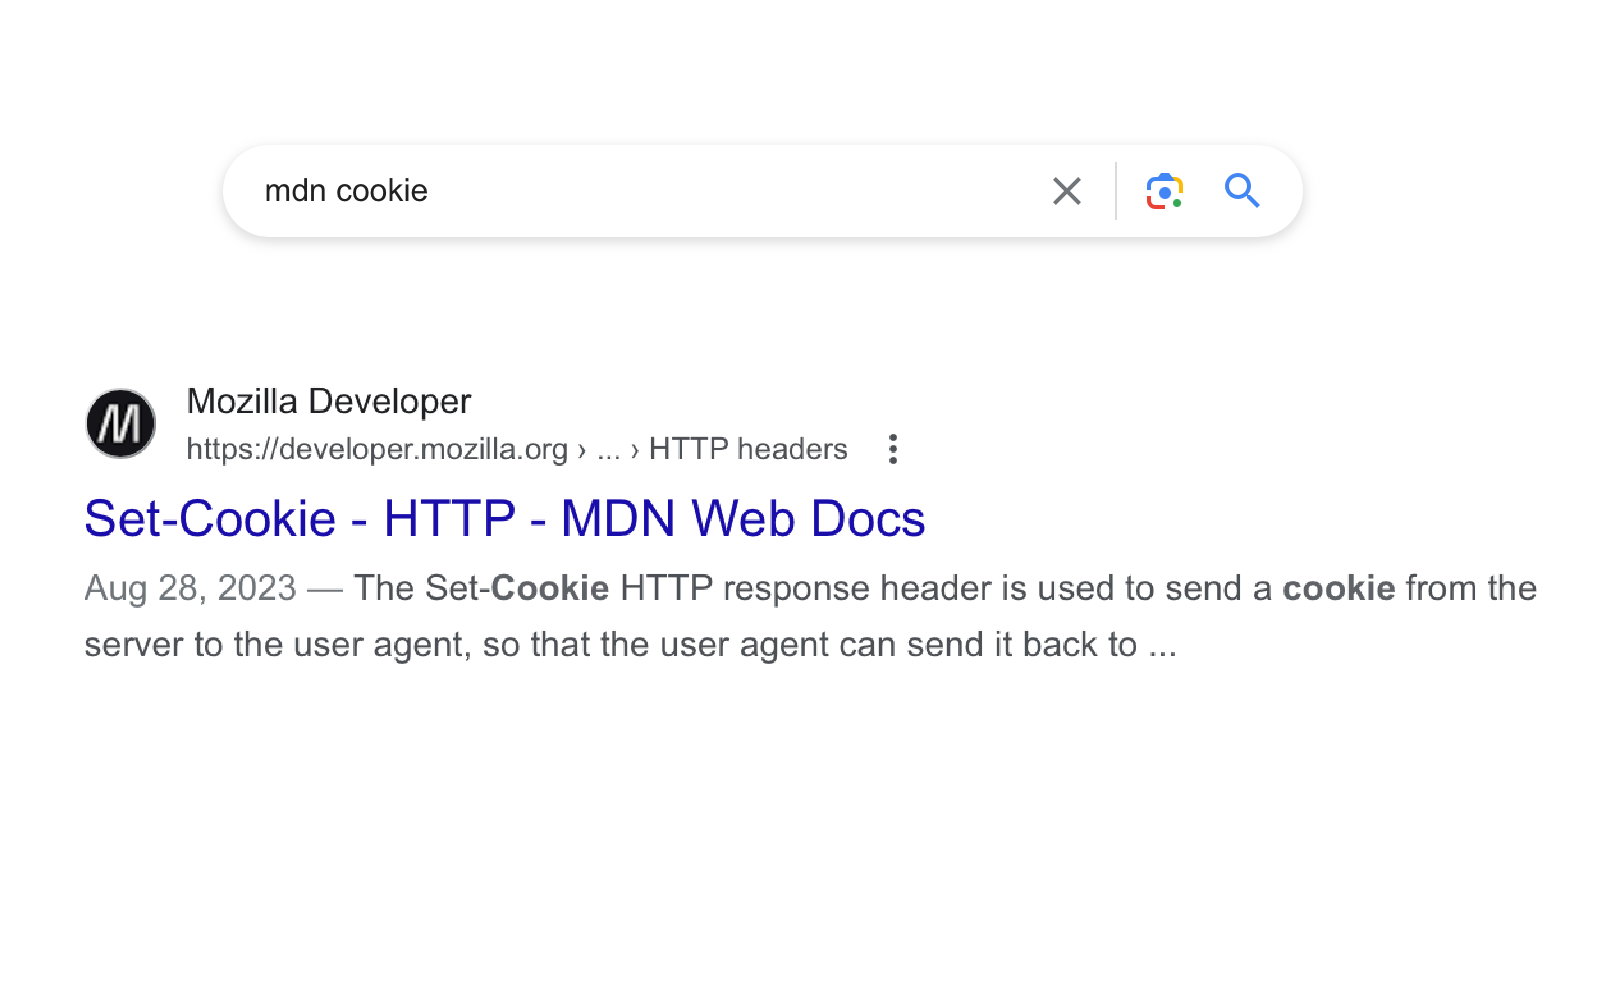
For HTTP, I think a lot of us use the Mozilla Developer Network.

Another HTTP reference I love is the official RFC, RFC 9110 (also 9111, 9112, 9113, 9114)
It's a new authoritative reference for HTTP and it was written just last
year, in 2022! They decided to organize all the information really nicely. So if you
want to know exactly what the Connection header does, you can look
it up.
This is not really my top reference. I'm usually on MDN. But I really appreciate that it's available.

So I love to share my favorite references.
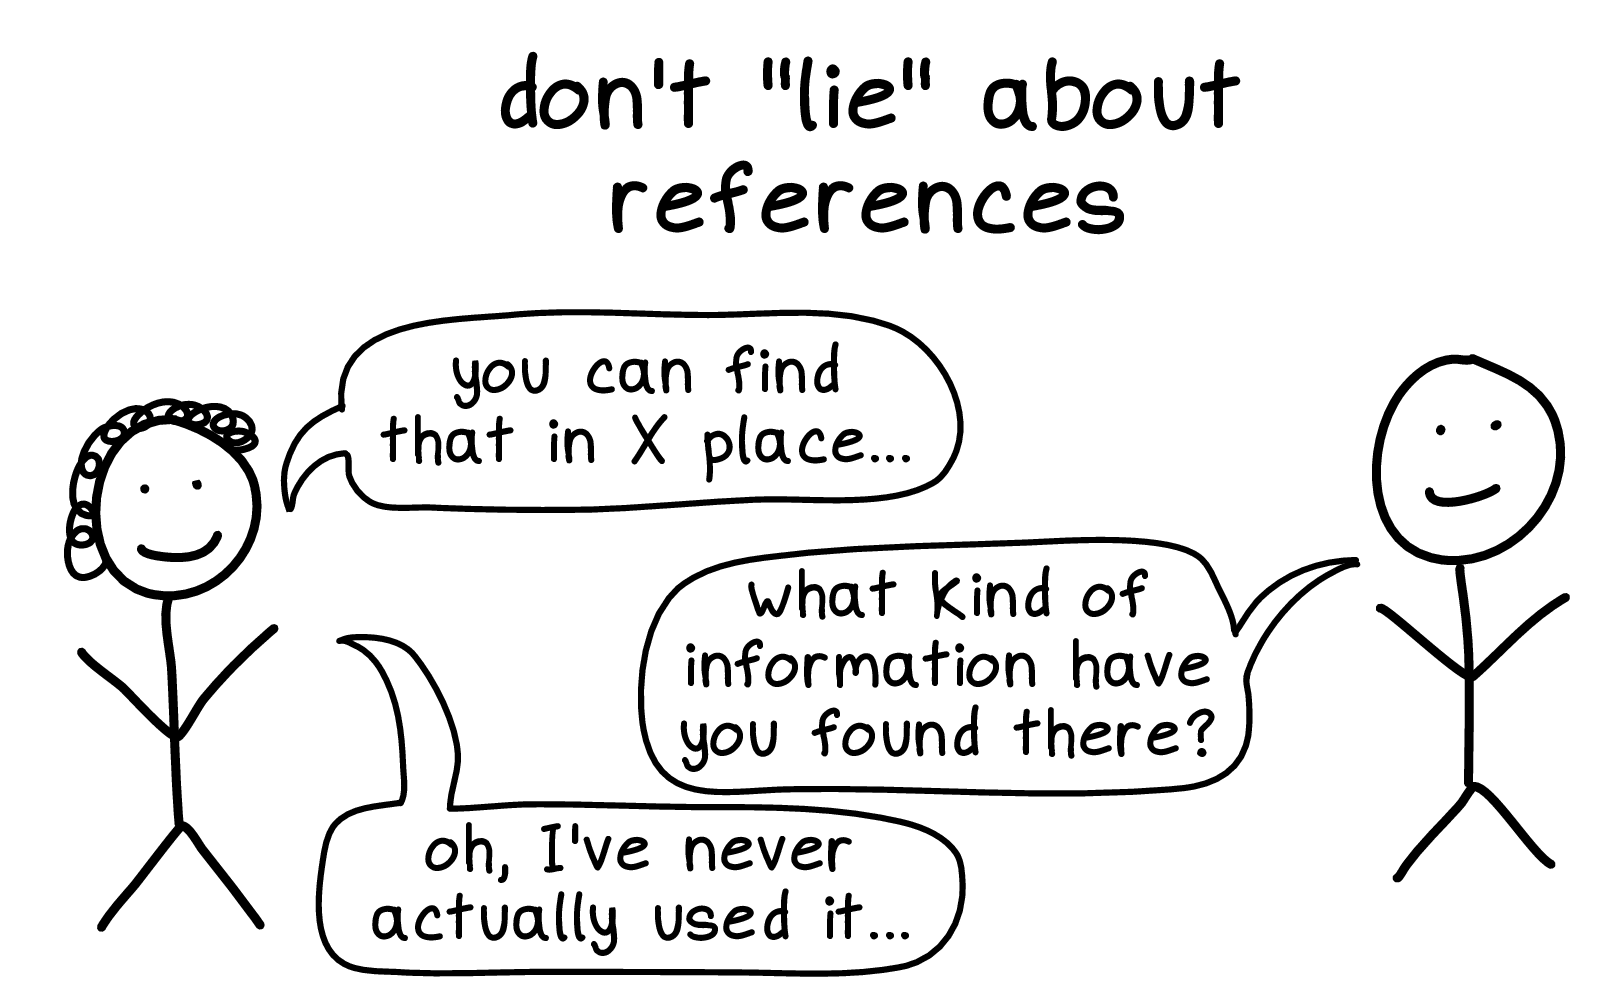
I do sometimes find it tempting to kind of lie about references. Not on purpose. But I'll see something on the internet, and I'll think it's kind of cool, and tell a friend about. But then my friend might ask me -- "when have you used this?" And I'll have to admit "oh, never, I just thought it seemed cool".
I think it's important to be honest about what the references that I'm actually using in real life are. Even if maybe the real references I use are a little "embarrassing", like maybe w3schools or something.


I started thinking about SQL because someone mentioned they're trying to learn SQL. I get most of my zine ideas that way, one person will make an offhand comment and I'll decide "ok, I'm going to spend 4 months writing about that". It's a weird process.
So I was wondering -- what's hard about SQL? What gets in the way of trying to learn that?
I want to say that when I'm confused about what's hard about something, that's a fact about me. It's not usually that the thing is easy, it's that I need to work on understanding what's hard about it. It's easy to forget when you've been using something for a while.
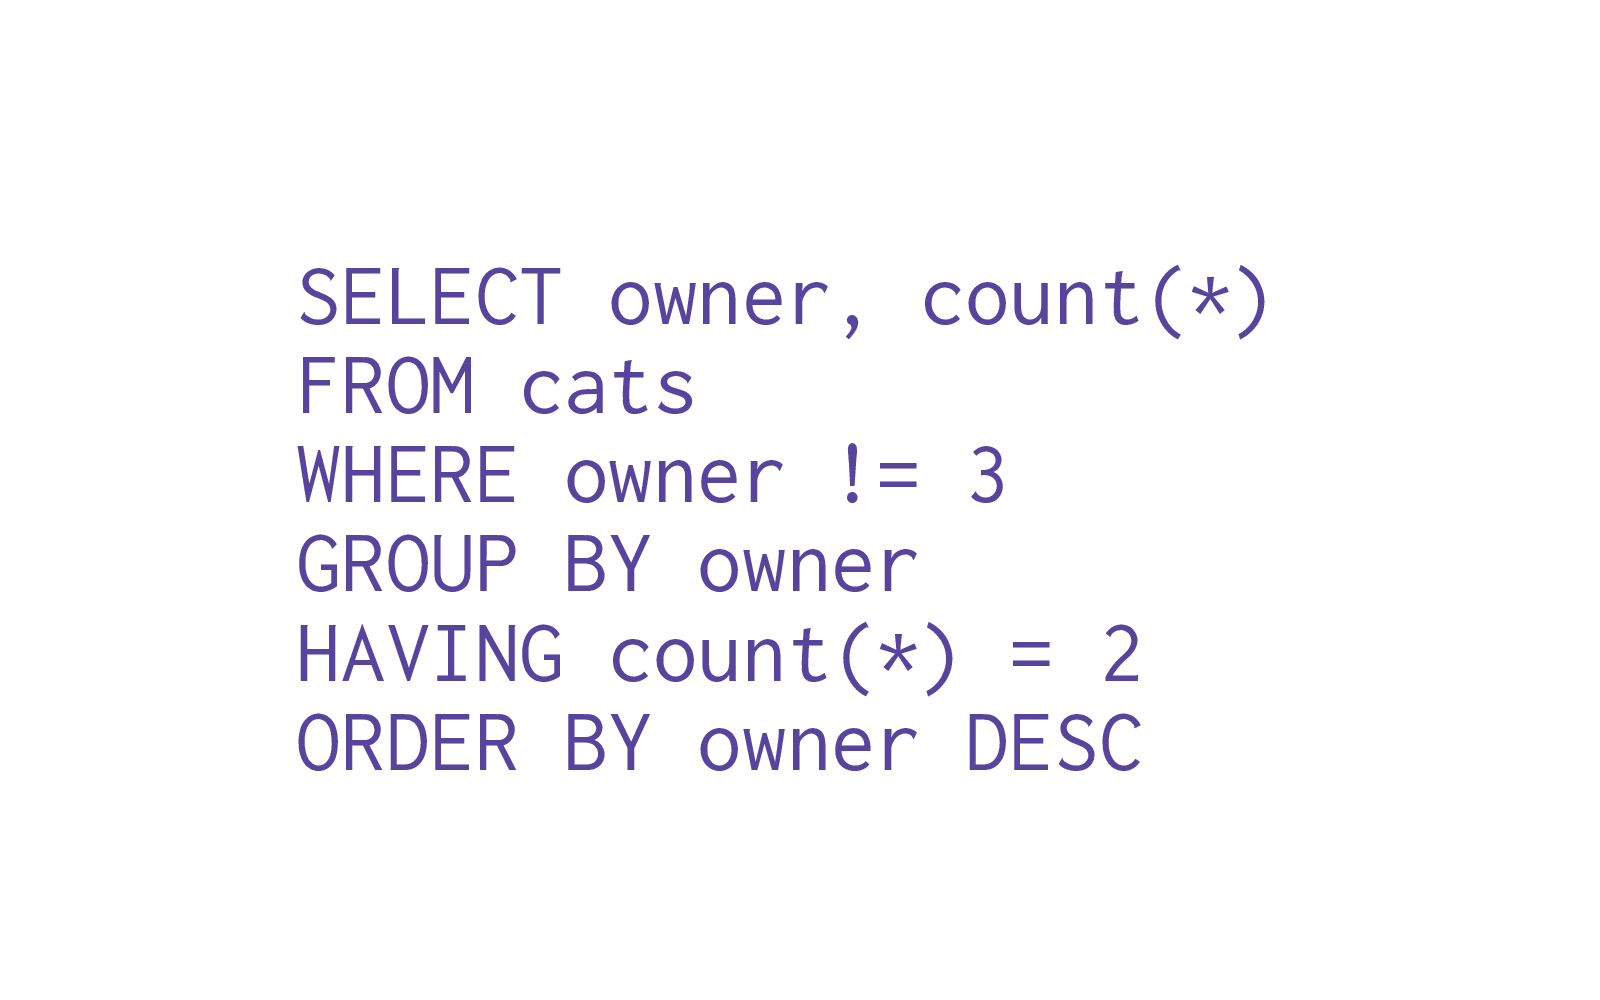
So, I was used to reading SQL queries. For example this made up query that tries to find people who own exactly two cats. It felt straightforward to me, SELECT, FROM, WHERE, GROUP BY.

But then I was talking to a friend about these queries who was new to SQL. And my friend asked -- what is this doing?
I thought, hmm, fair point.
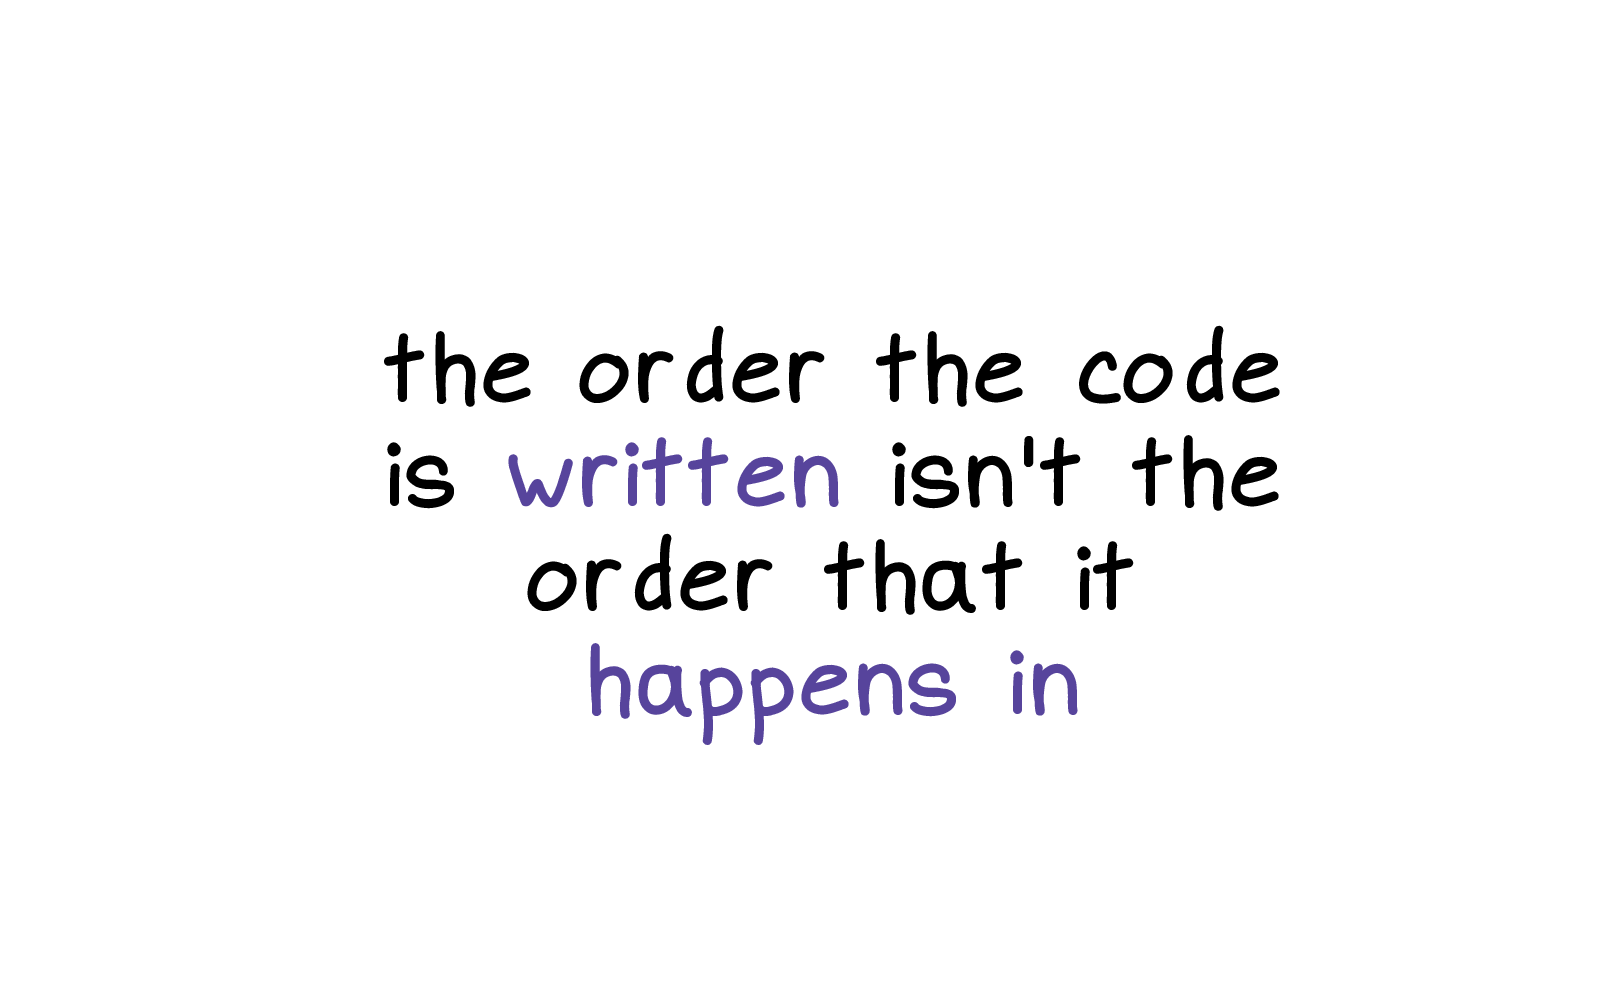
And I think the point my friend was making was that the order that this SQL query is written in, is not the order that it actually happens in. It happens in a different order, and it's not immediately obvious what that is.


I like to think about: what does the computer do first? What actually happens first chronologically?
Computers actually do live in the same timeline as us. Things happen. Things happen in an order. So what happens first?
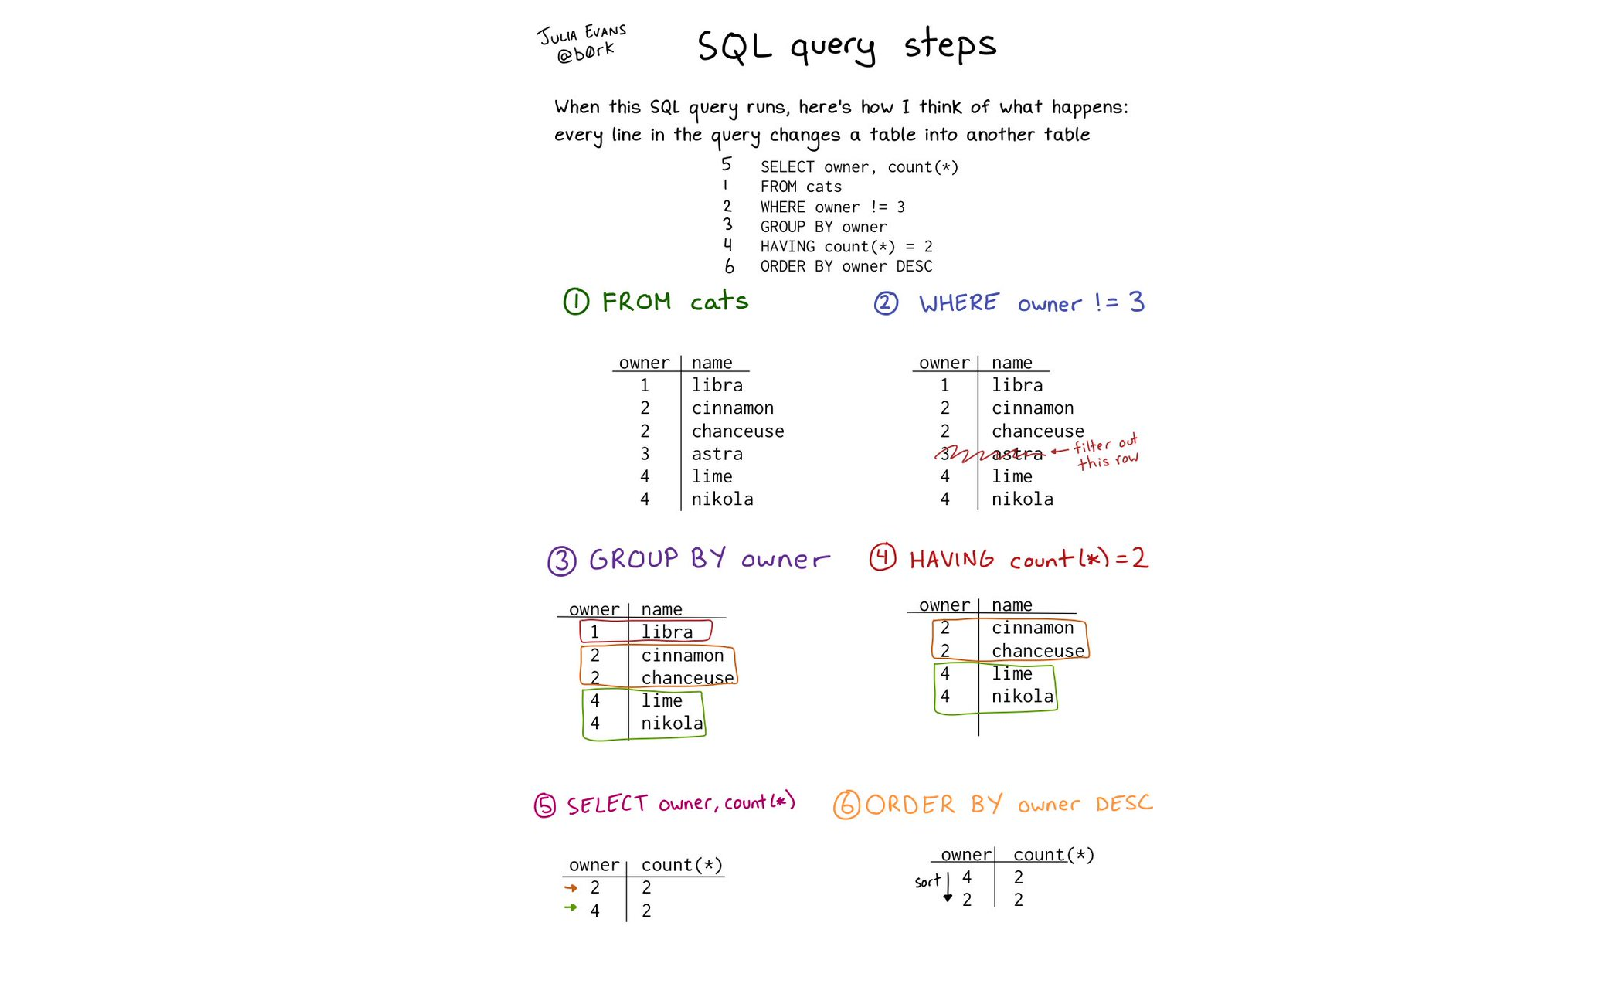
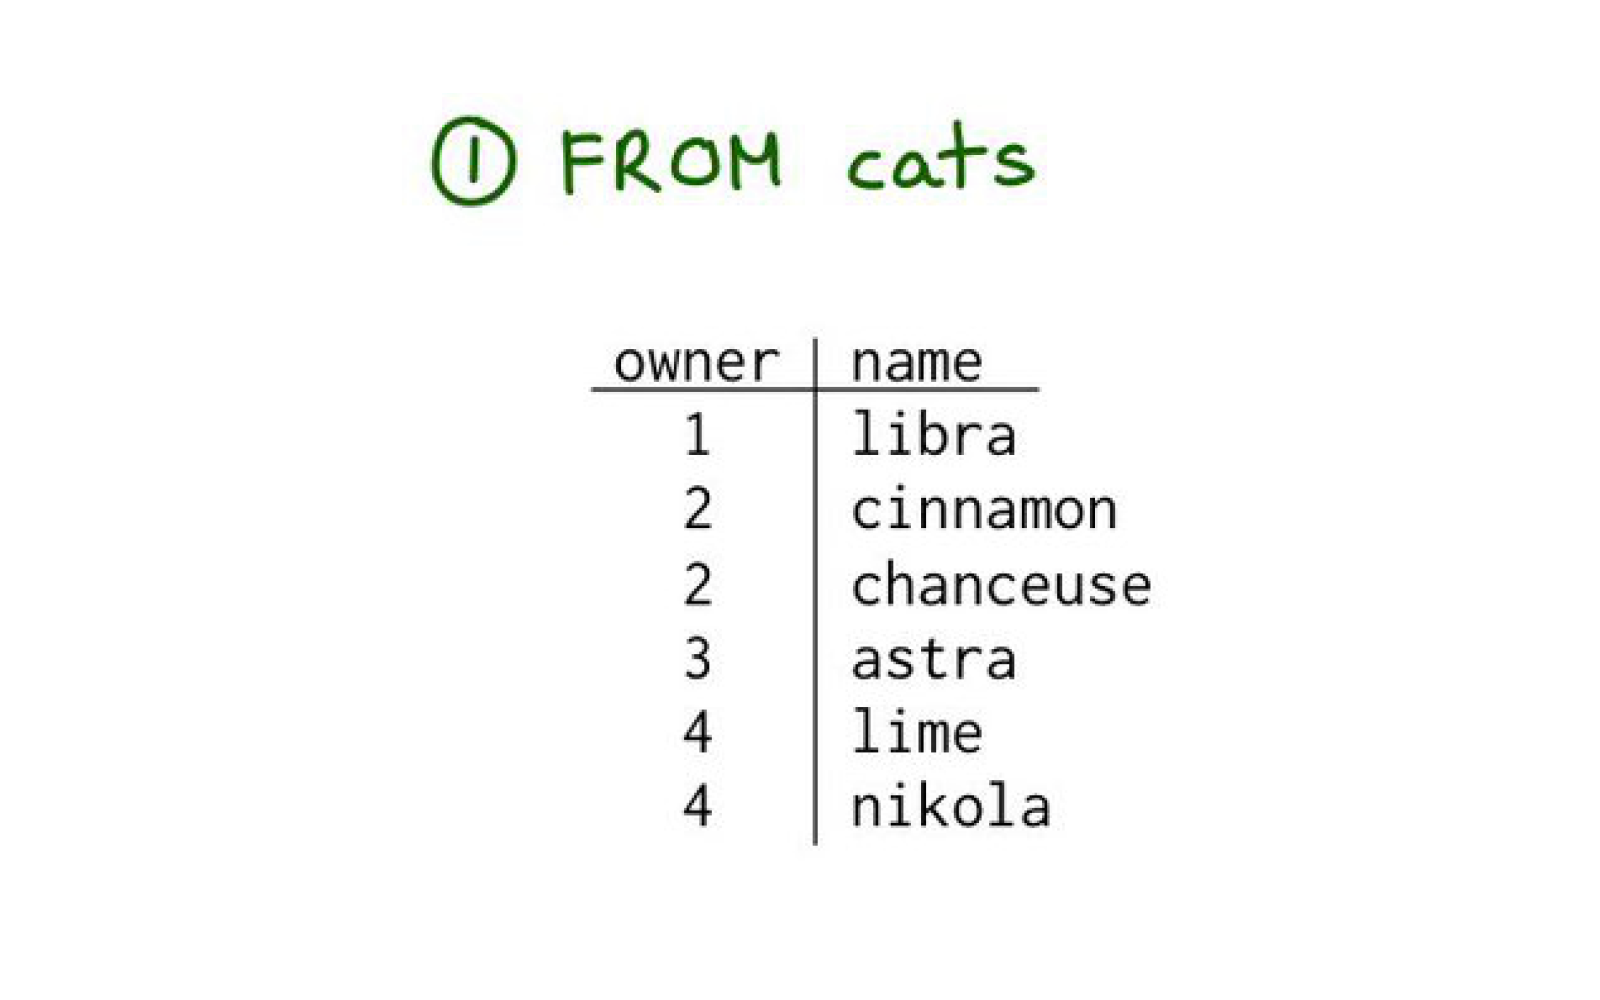
cats.

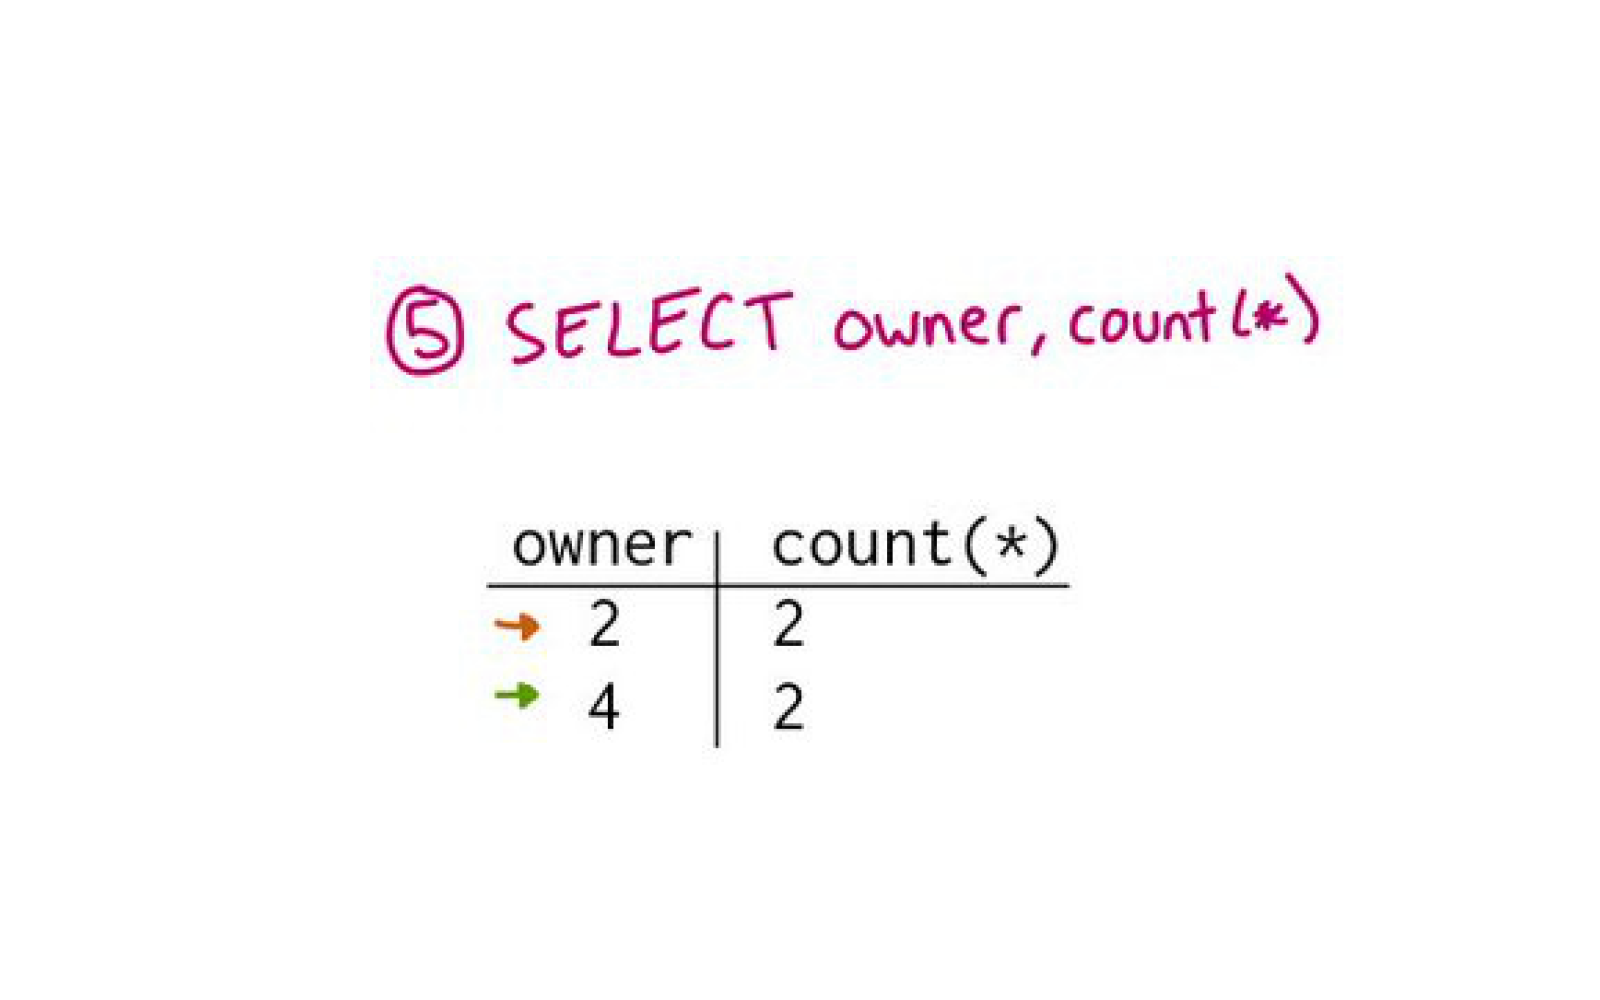
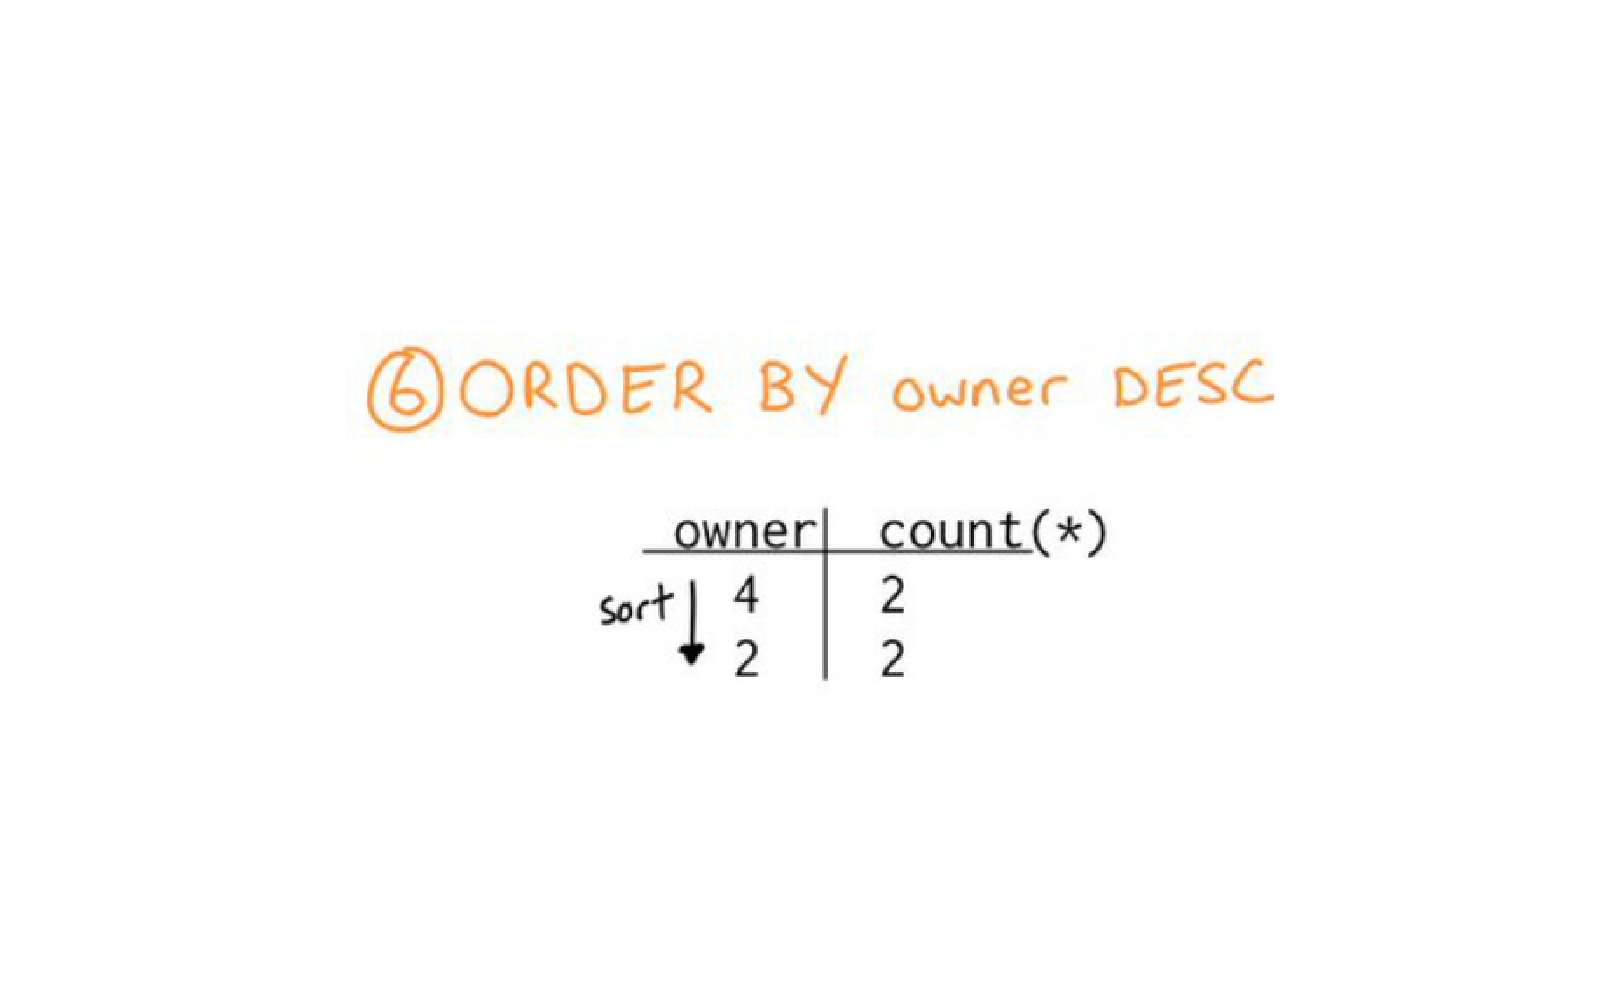
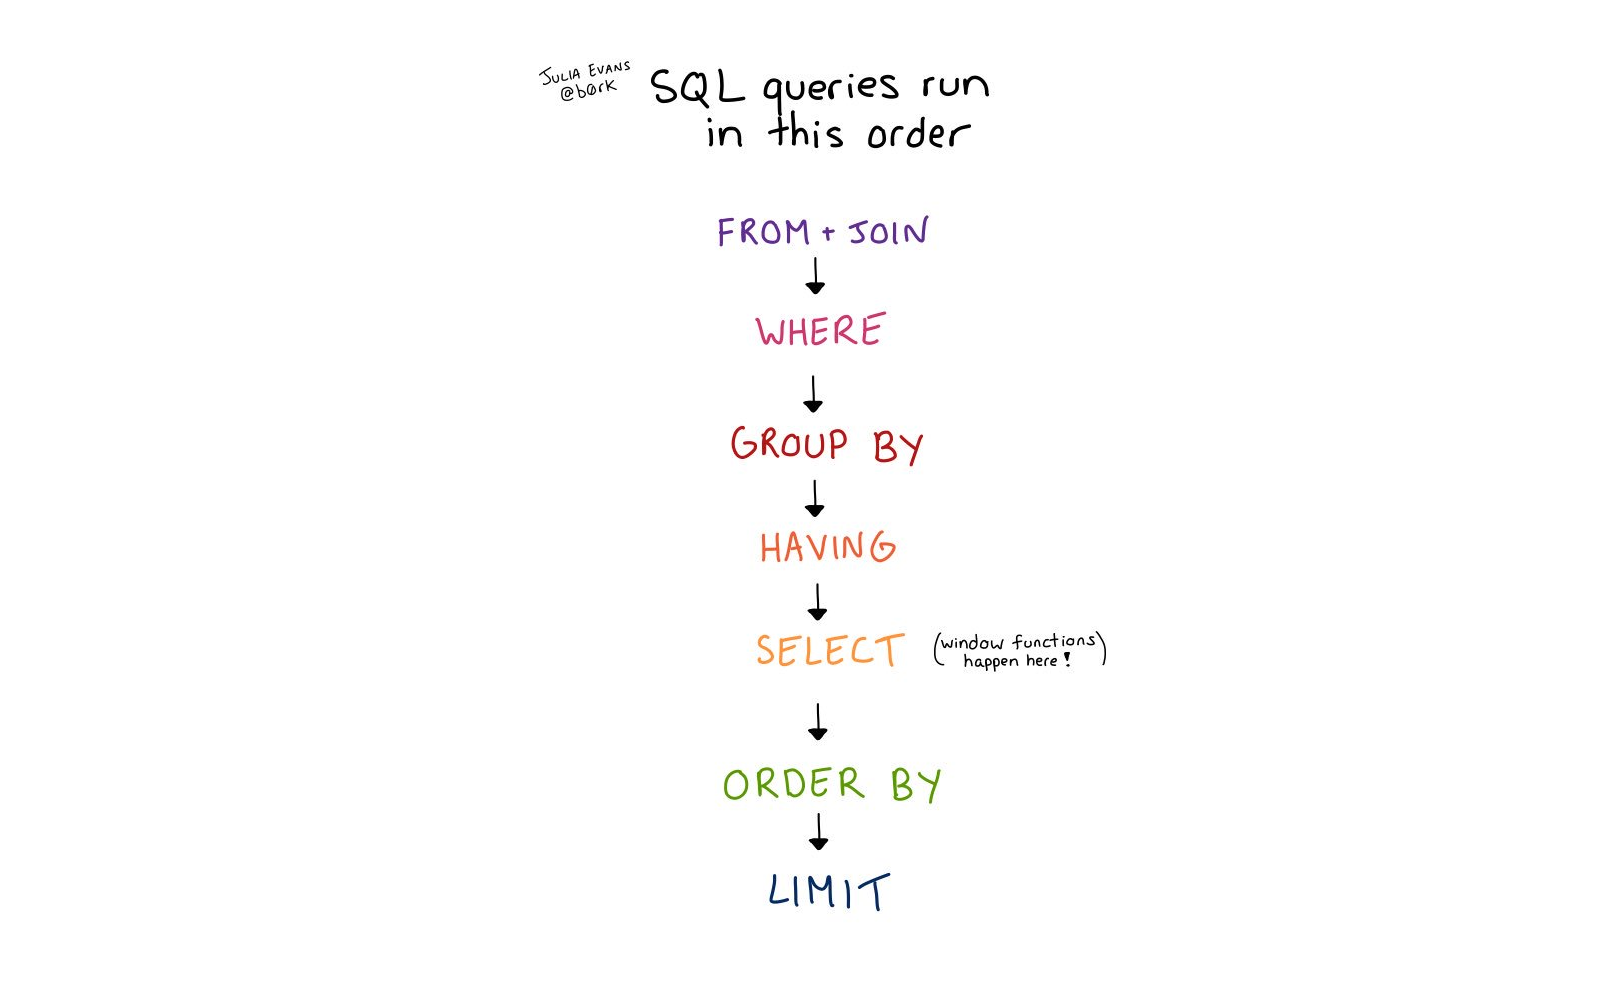
So, that's how I think about SQL. The way a query runs is first FROM, then WHERE, GROUP BY, HAVING, SELECT, ORDER BY, LIMIT.
At least conceptually. Real life databases have optimizations and it's more complicated than that. But this is the mental model that I use most of the time and it works for me. Everything is in the same order as you write it, except SELECT is fifth.

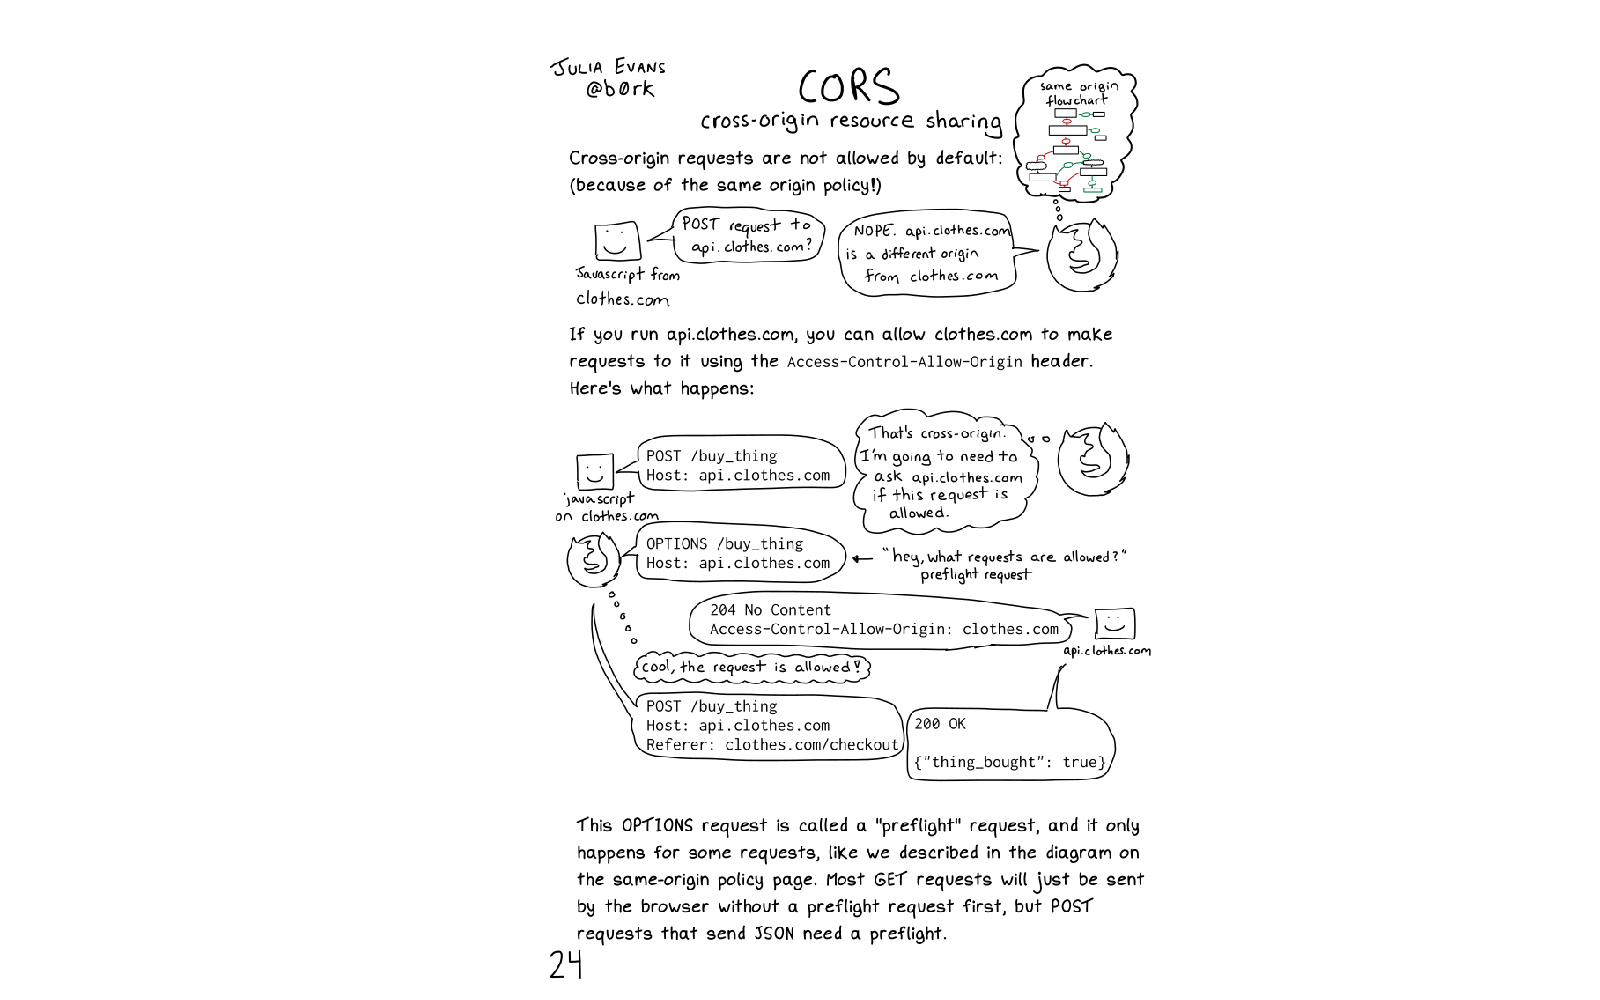
One is CORS, in HTTP.
This comic is way too small to read on the slide. But the idea is if you're making a cross-origin request in your browser, you can write down every communication that's happening between your browser and the server, in chronological order.
And I think writing down everything in chronological order makes it a lot easier to understand and more concrete.

"What happens in chronological order?" is a very straightforward structure, which is what I like about it. "What happens first?" feels like it should be easy to answer. But it's not!
I've found that it's actually very hard to know what our computers is doing, and it's a really fun question to explore.
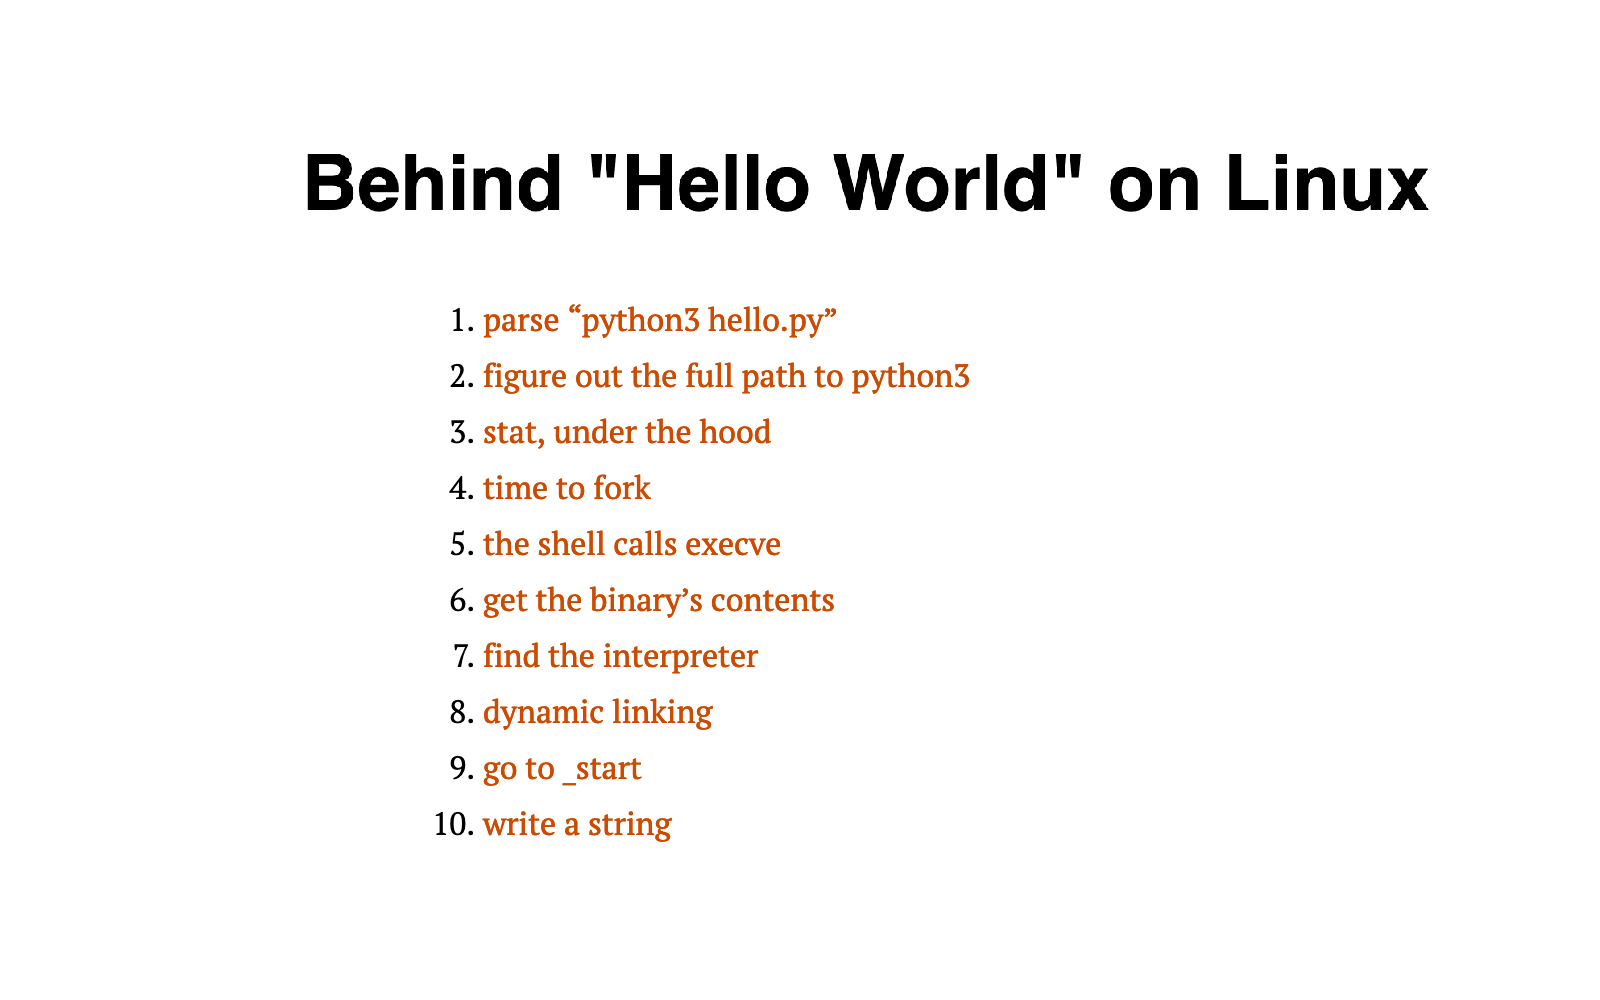
As an example of how this is hard: I wrote a blog post recently called "Behind Hello World on Linux". It's about what happens when you run "hello world" on a Linux computer. I wrote a bunch about it, and I was really happy with it.
But after I wrote the post, I thought -- haven't I written about this before? Maybe 10 years ago?

And sure enough, I'd tried to write a similar post 10 years before.
I think this is really cool. Because the 2013 version of this post was about 6 times shorter. This isn't because Linux is more complicated than it was 10 years ago -- I think everything in the 2023 post was probably also true in 2013. The 2013 post just has a lot less information in it.
The reason the 2023 post is longer is that I didn't know what was happening chronologically on my computer in 2013 very well, and in 2023 I know a lot more. Maybe in 2033 I'll know even more!
I think a lot of us -- like me in 2013 and honestly me now, often don't know the facts of what's happening on our computers. It's very hard, which is what makes it such a fun question to try and discuss.

I think it's cool that all of us have different knowledge about what is happening chronologically on our computers and we can all chip in to this conversation.
For example when I posted this blog post about Hello World on Linux, some people mentioned that they had a lot of thoughts about what happens exactly in your terminal, or more details about the filesystem, or about what's happening internally in the Python interpreter, or any number of things. You can go really deep.
I think it's just a really fun collaborative question.

I've seen "what happens chronologically?" work really well as an activity with coworkers, where you're ask: "when a request comes into this API endpoint we run, how does that work? What happens?"
What I've seen is that someone will understand some part of the system, like "X happens, then Y happens, then it goes over to the database and I have no idea how that works". And then someone else can chime in and say "ah, yes, with the database A B C happens, but then there's a queue and I don't know about that".
I think it's really fun to get together with people who have different specializations and try to make these little timelines of what the computers are doing. I've learned a lot from doing that with people.

Even though I struggled with DNS. Once I got figured it out, I felt like "dude, this is easy!". Even though it just took me 10 years to learn how it works.
But of course, DNS was pretty hard for me to learn. So -- why is that? Why did it take me so long?
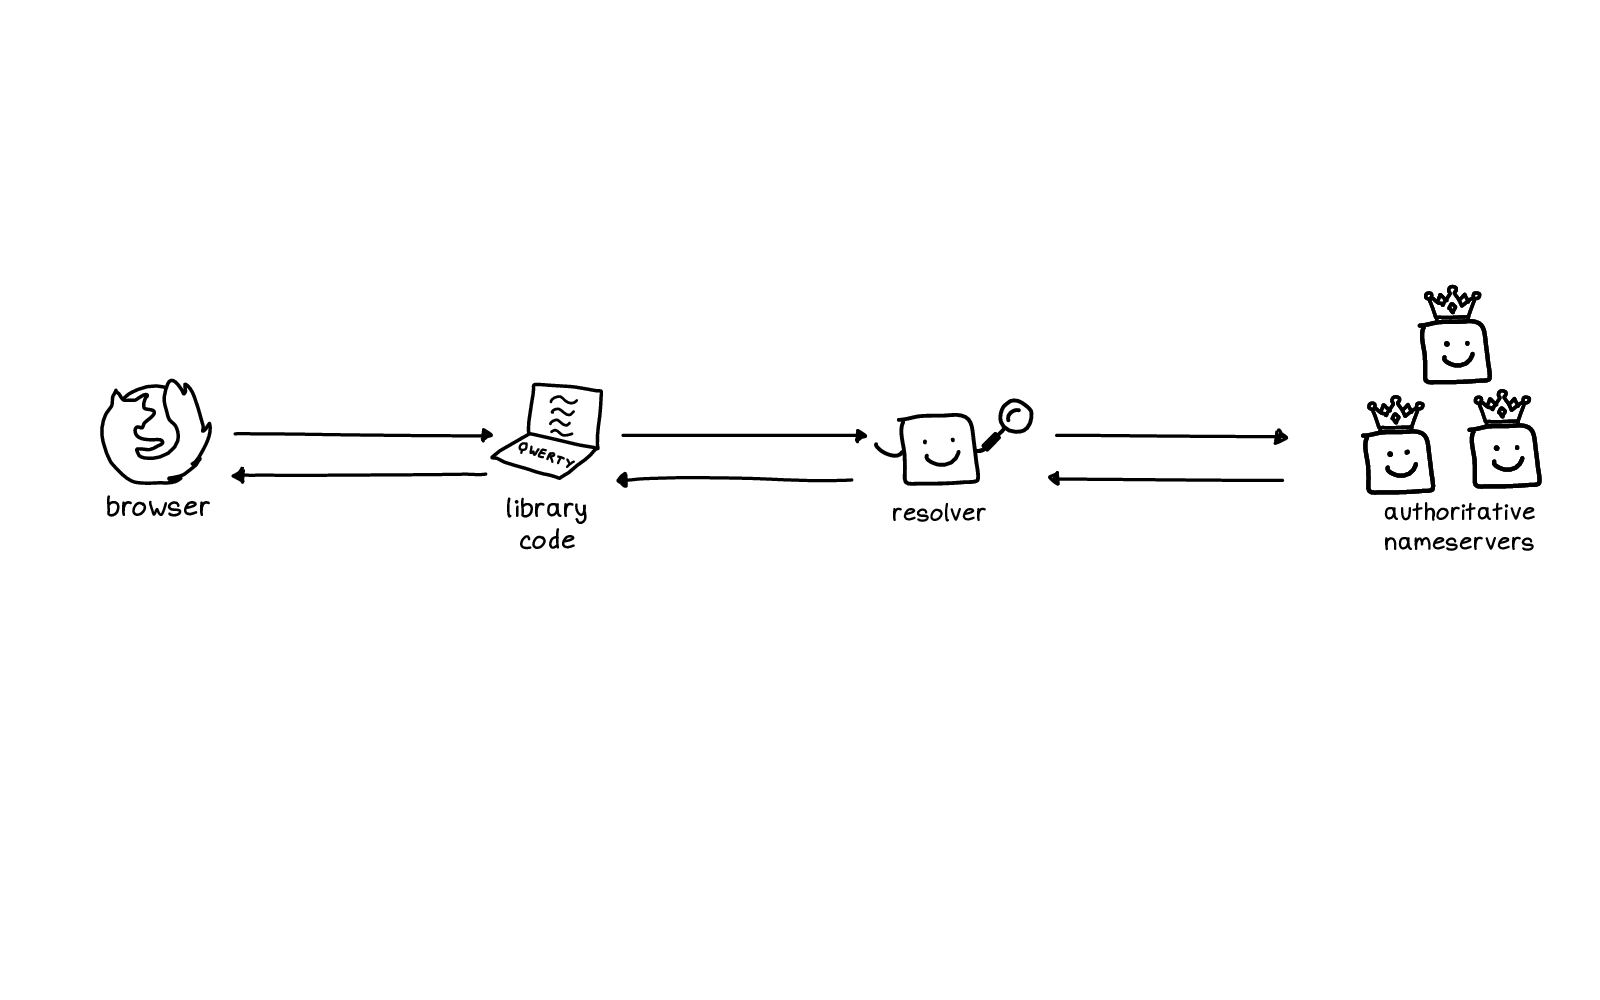
So, I have a little chart here of how I think about DNS.
You have your browser on the left. And over on the right there's the authoritative nameservers, the source of truth of where the DNS records for a domain live.
In the middle, there's a function that you call and a cache. So you have browser, function, cache, source of truth.
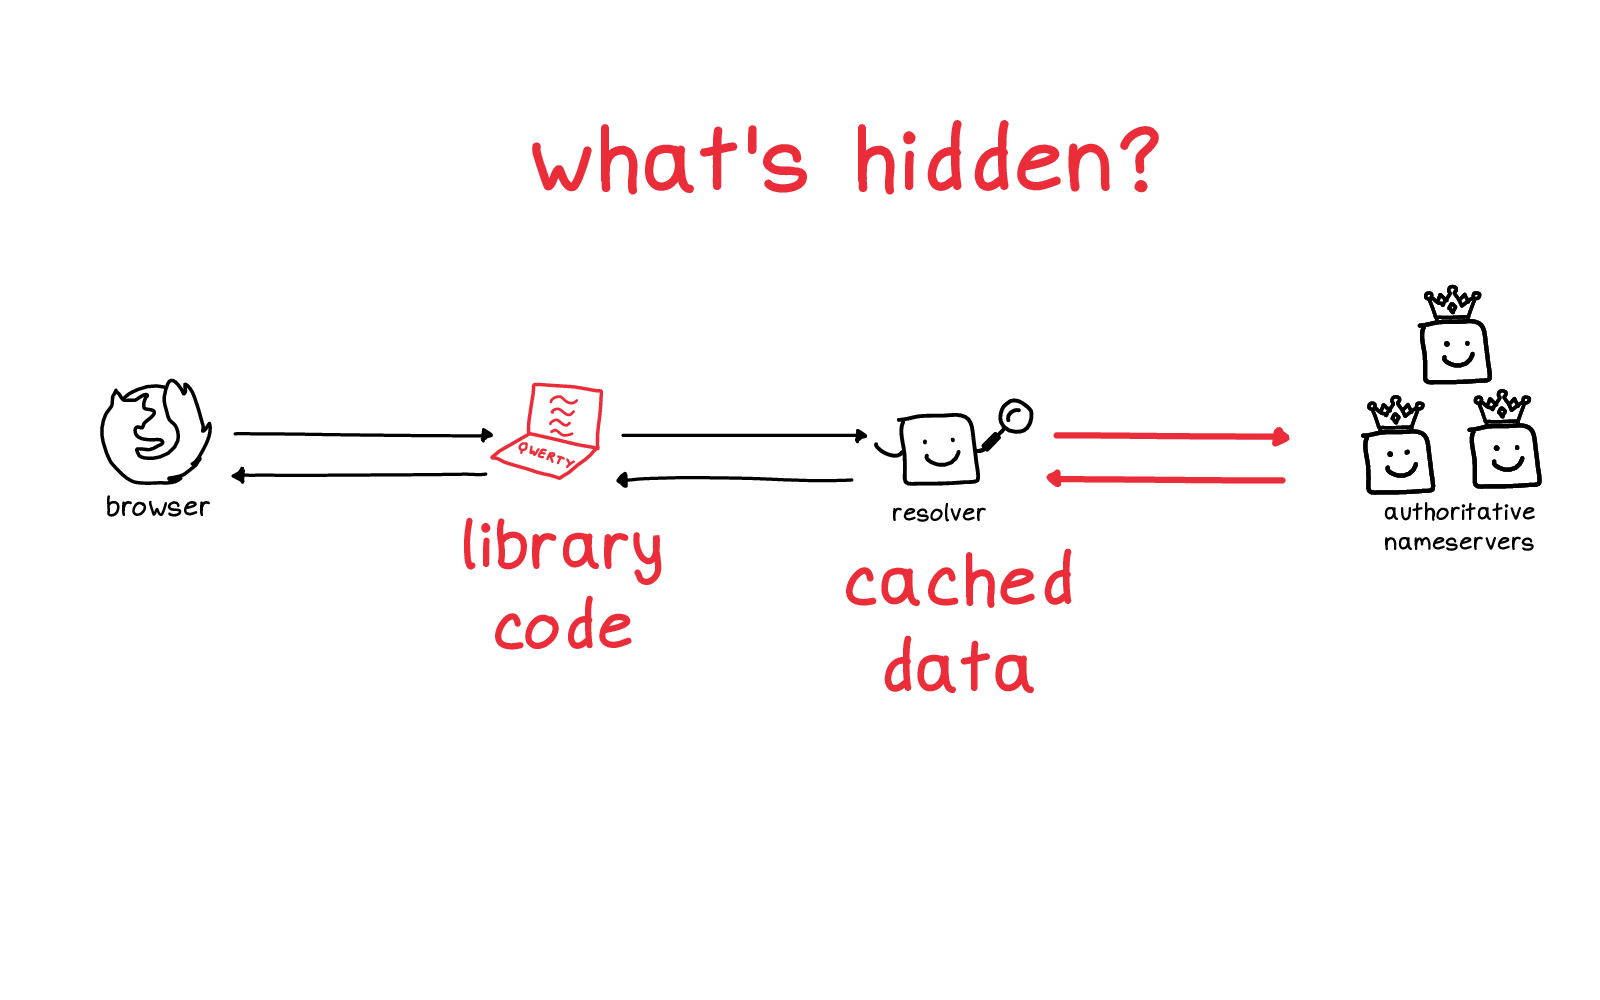
One problem is that there are a lot of things in this diagram that are totally hidden from you.
The library code that you're using where you make a DNS request -- there are a lot of different libraries you could be using, and it's not straightforward to figure out which one is being used. That was the source of some of my confusion.
There's a cache which has a bunch of cached data. That's invisible to you, you can't inspect it easily and you have no control over it. that
And there's a conversation between the cache and the source of truth, these two red arrows which also you can't see at all.
So this is kind of tough! How are you supposed to develop an intuition for a system when it's mostly things that are completely hidden from you? Feels like a lot to expect.

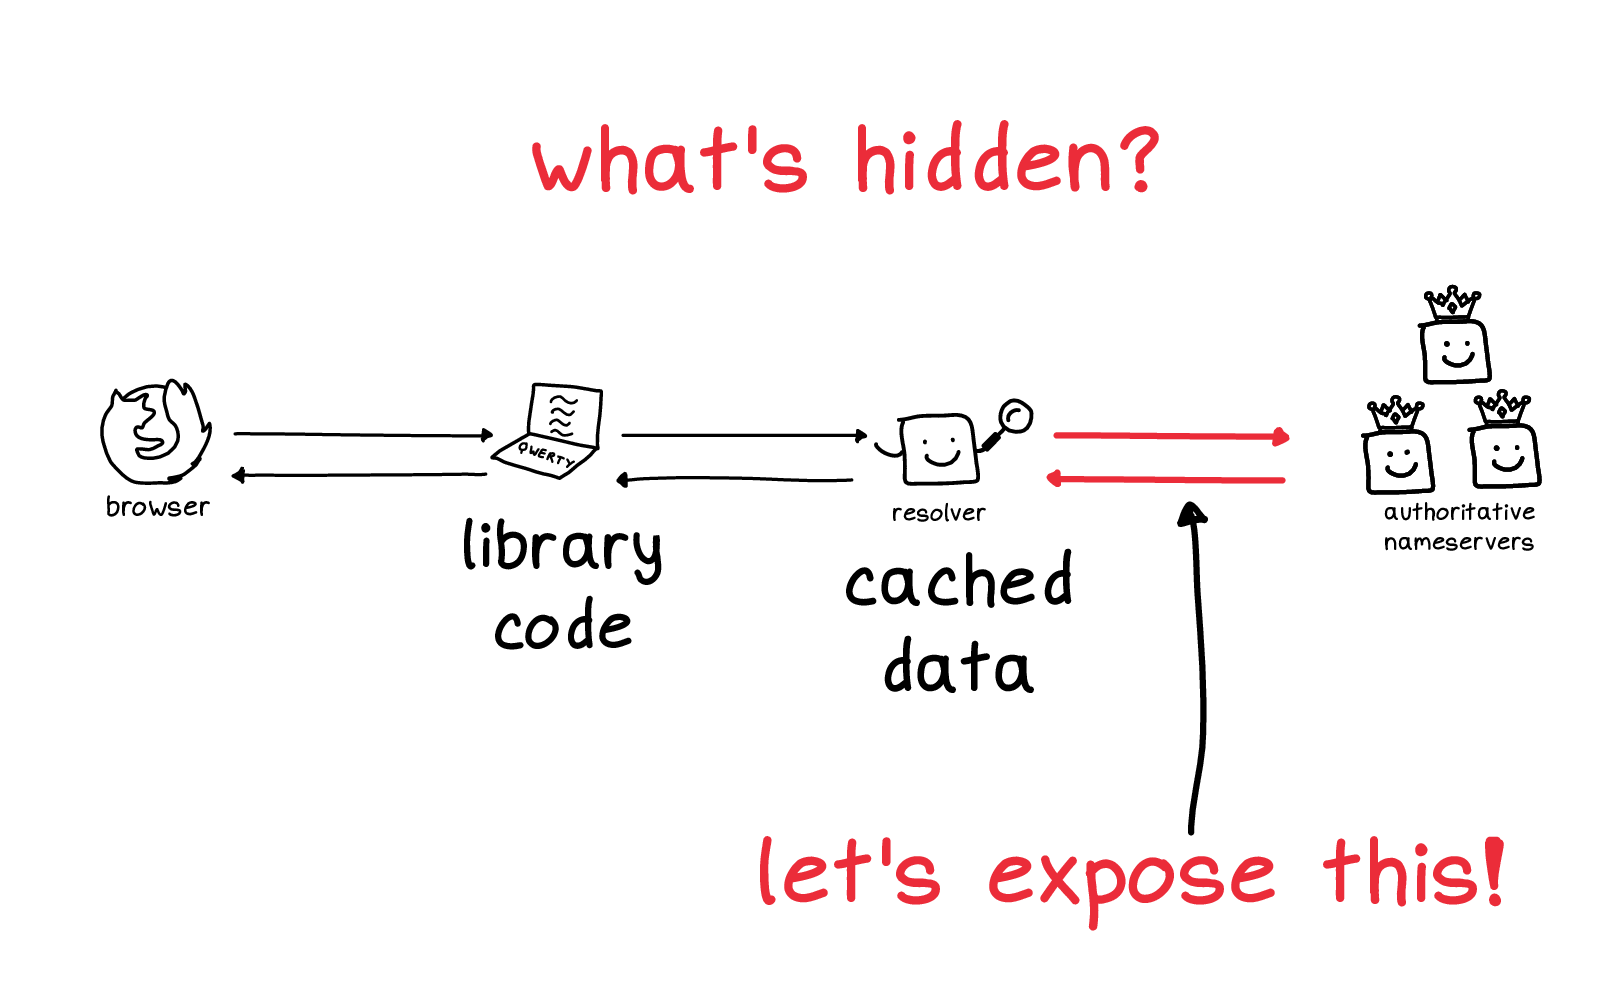
So: let's talk about these red arrows on the right.
We have our cache and then we have the source of truth. This conversation is normally hidden from you because you often don't control either of these servers. Usually they're too busy doing high-performance computing to report to you what they're doing.
But I thought: anyone can write an authoritative nameserver! In particular, I could write one that reports back every single message that it receives to its users. So, with my friend Marie, we wrote a little DNS server.

(demo of messwithdns.net)
This is called Mess With DNS. The idea is I have a domain name and you
can do whatever you want with it. We're going to make a DNS record called
strangeloop, and we're going to make a CNAME record pointing at
orange.jvns.ca, which is just a picture of an orange. Because I
like oranges.
And then over here, every time a request comes in from a resolver, this will -- this will report back what happened. So, if we click on this link, we can see -- a Canadian DNS resolver, which is apparently what my browser is configured to use, is requesting an IPv4 record and an IPv6 record, A and AAAA.
(at this point in the demo everyone in the audience starts visiting the link and it gets a bit chaotic, it's very funny)
So the trick here is to find ways to show people parts of what the computer is doing that are normally hidden.

Another great example of showing things that are hidden is this website called float.exposed by Bartosz Ciechanowski who makes a lot of incredible visualizations.
So if you look at this 32-bit floating point number and click the "up" button on the significand, it'll show you the next floating point number, which is 2 more. And then as you make the number bigger and bigger (by increasing the exponent), you can see that the floating point numbers get further and further apart.
Anyway, this is not a talk about floating point. I could do an entire talk about this site and how we can use it to see how floating point works, but that's not this talk.

Another thing that makes DNS confusing is that it's a giant distributed system -- maybe you're confused because there are 5 million computers involved (really, more!). Most of which you have no control over, and some are doing not what they're supposed to do.
So that's another trick for understanding why things are hard, check to see if there are actually 5 million computers involved.

So what else is hard about DNS?
We've talked about how most of the system is hidden from you, and about how it's a big distributed system.

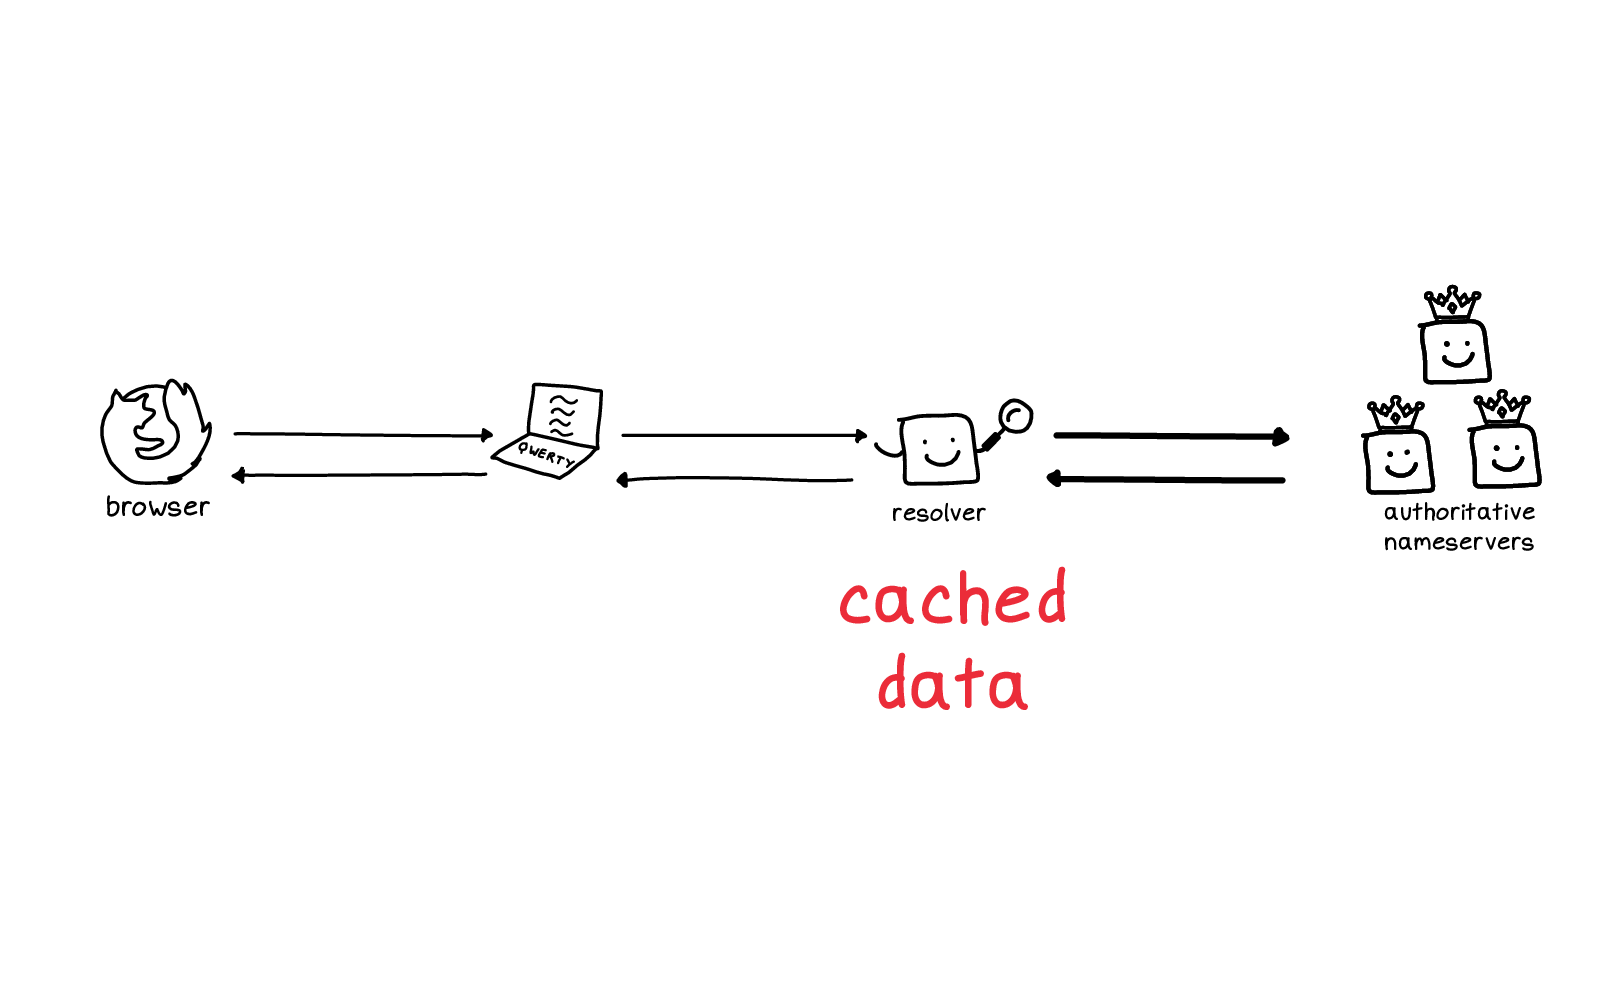
One of the hidden things I talked about was: the resolver has cached data, right? And you might be curious about whether a certain domain name is cached or not by your resolver right now.
Just to understand what's happening: am I getting this result because it was cached? What's the deal?
I said this was hidden, but there are a couple of ways to query a resolver to see what it has cached, and I want to show you one of them.

dig, and
it has a flag called +norecurse. You can use it to query a
resolver and ask it to only return results it already has cached.
With dig +norecurse jvns.ca, I'm kind of asking -- how popular is my website? Is it popular enough that someone has visited it in the last 5 minutes?
Because my records are not cached for that long, only for 5 minutes.
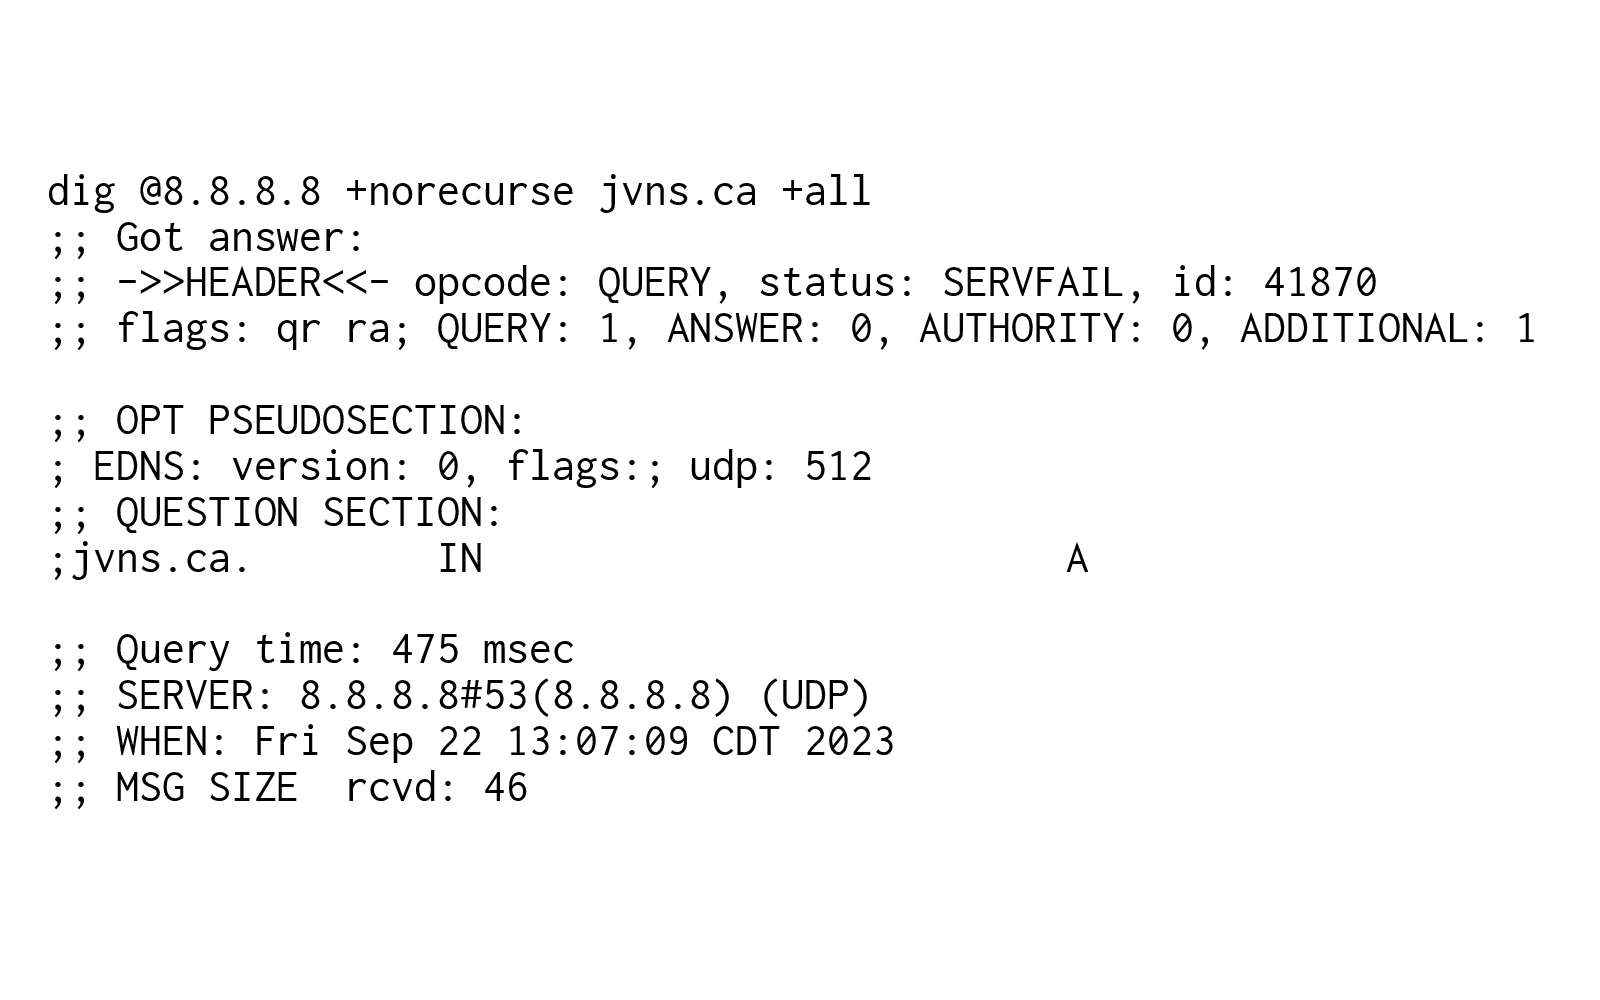
But when I look at this response, I feel like "please! What is all this?"
And when I show newcomers this output, they often respond by saying "wow, that's complicated, this DNS thing must be really complicated". But really this is just not a great output format, I think someone just made some relatively arbitrary choices about how to print this stuff out in the 90s and it's stayed that way ever since.
So a bad output format can mislead newcomers into thinking that something is more complicated than it actually is.


One of my favorite tricks, I call eraser eyes.
Because when I look at that output, I'm not looking at all of it, I'm just looking at a few things. My eyes are ignoring the rest of it.
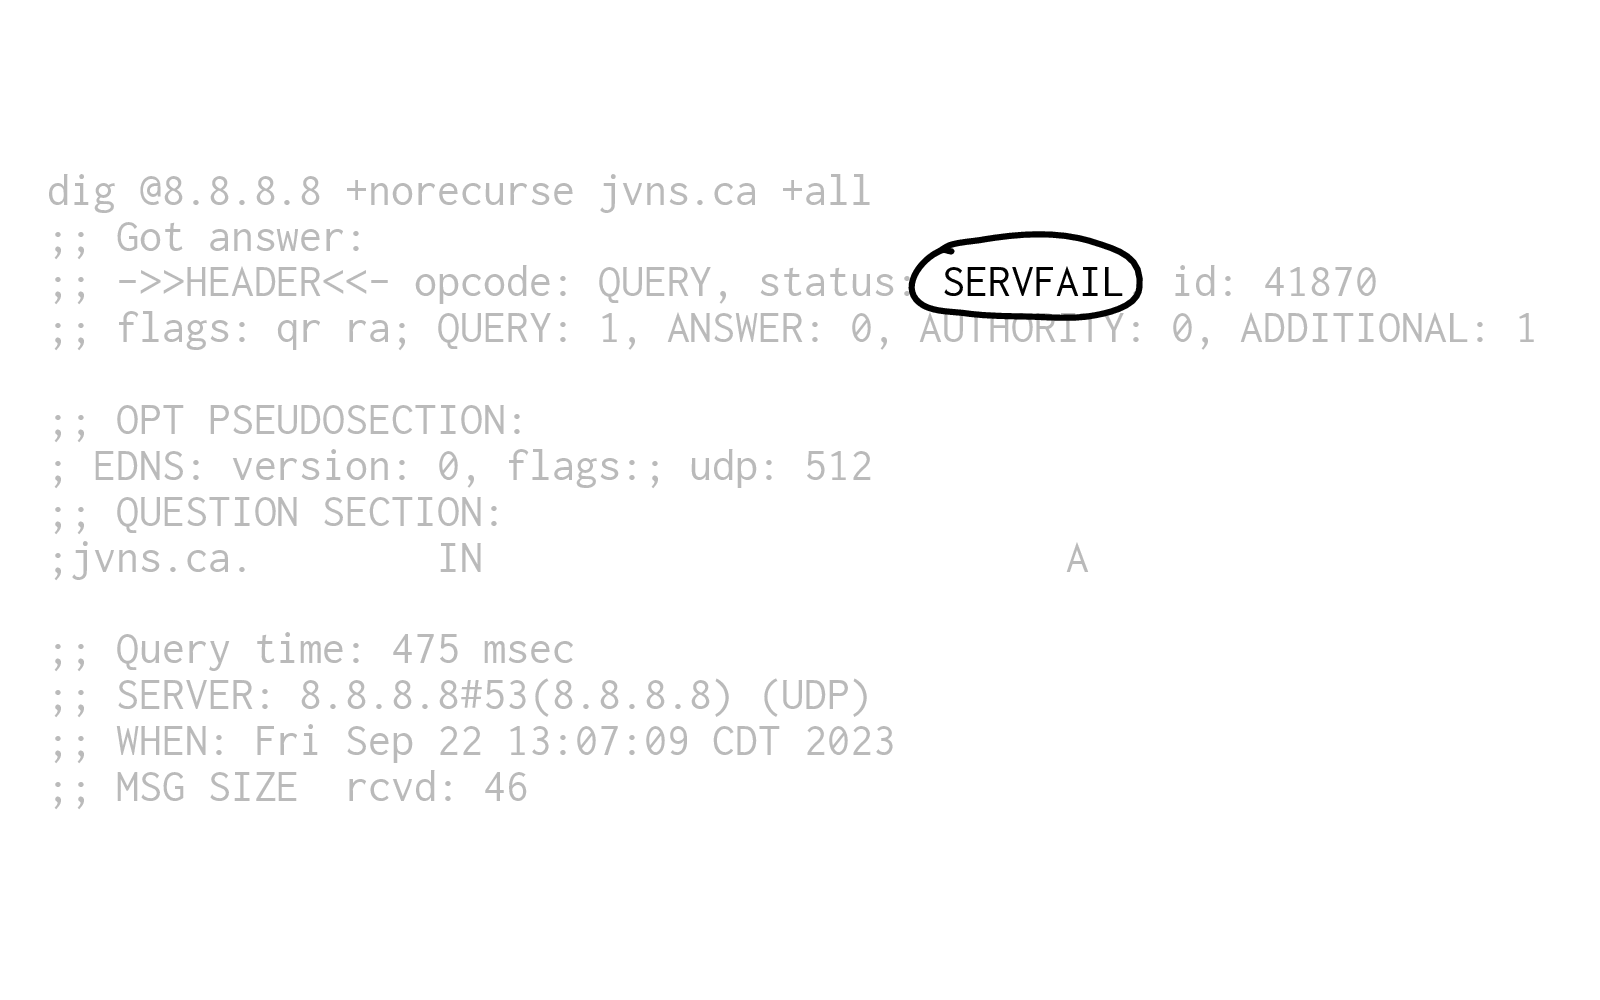
When I look at the output, this is what I see: it says SERVFAIL.
That's the DNS response code.
Which as I understand it is a very unintuitive way of it saying, "I do not have that in my cache". So nobody has asked that resolver about my domain name in the last 5 minutes, which isn't very surprising.
I've learned so much from people doing a little demo of a tool, and showing how they use it and which parts of the output or UI they pay attention to, and which parts they ignore.
Becuase usually we ignore most of what's on our screens!
I really love to use dig even though it's a little hairy because
it has a lot of features (I don't know of another DNS debugging that supports this
+norecurse trick), it's everywhere, and it hasn't changed in a
long time. And I know if I learn its weird output format once I can know that
forever. Stability is really valuable to me.
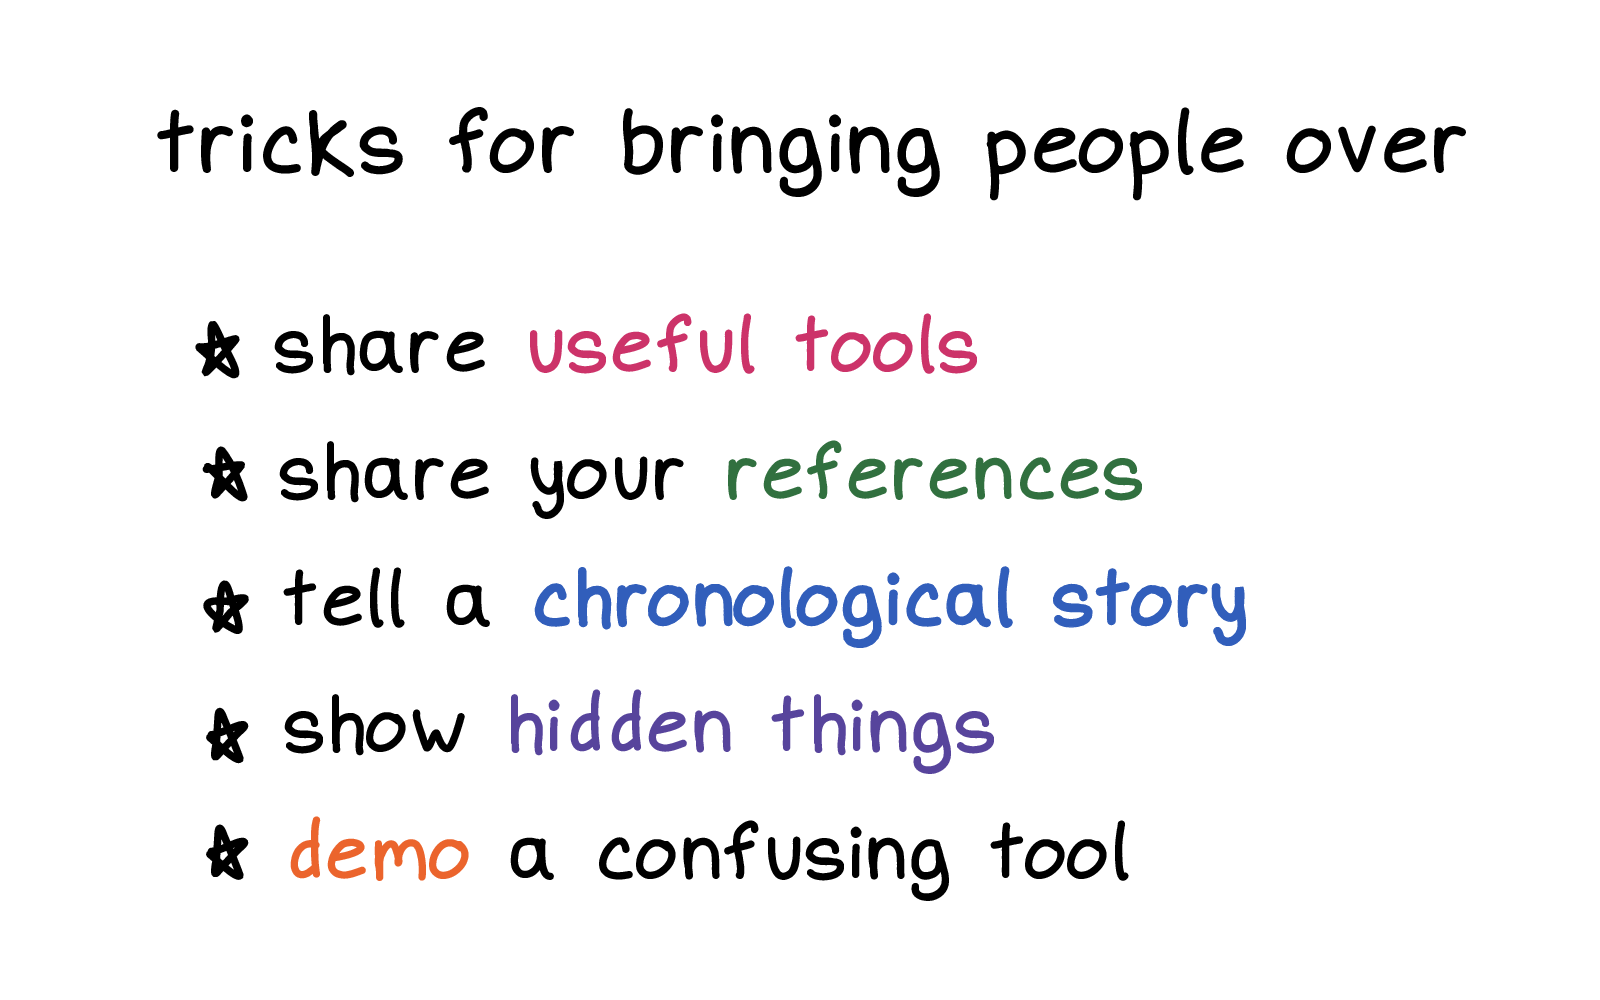
We've talked about some tricks I use to bring people over, like:
- sharing useful tools
- sharing references
- telling a chronological story of what happens on your computer
- turning a big list into a small list of the things you actually use
- showing the hidden things
- demoing a confusing tool and telling folks which parts I pay attention to

When I practiced this talk, I got some feedback from people saying "julia! I don't do those things! I don't have a blog, and I'm not going to start one!"
And it's true that most people are probably not going to start programming blogs.

But I really don't think you need to have a public presence on the internet to tell the people around you a little bit about how you use computers and how you understand them.

My experience is that a lot of people (who do not have blogs!) have helped me understand how computers work and have shared little pieces of their experience with computers with me.
I've learned a lot from my friends and my coworkers and honestly a lot of random strangers on the Internet too. I'm pretty sure some of you here today have helped me over the years, maybe on Twitter or Mastodon.
So I want to talk about some archetypes of helpful people

One kind of person who has really helped me is the grumpy old-timer. I'll say "this is so cool". And they'll reply yes, however, let me tell you some stories of how this has gone wrong in my life.
And those stories have sometimes helped spare me some suffering.
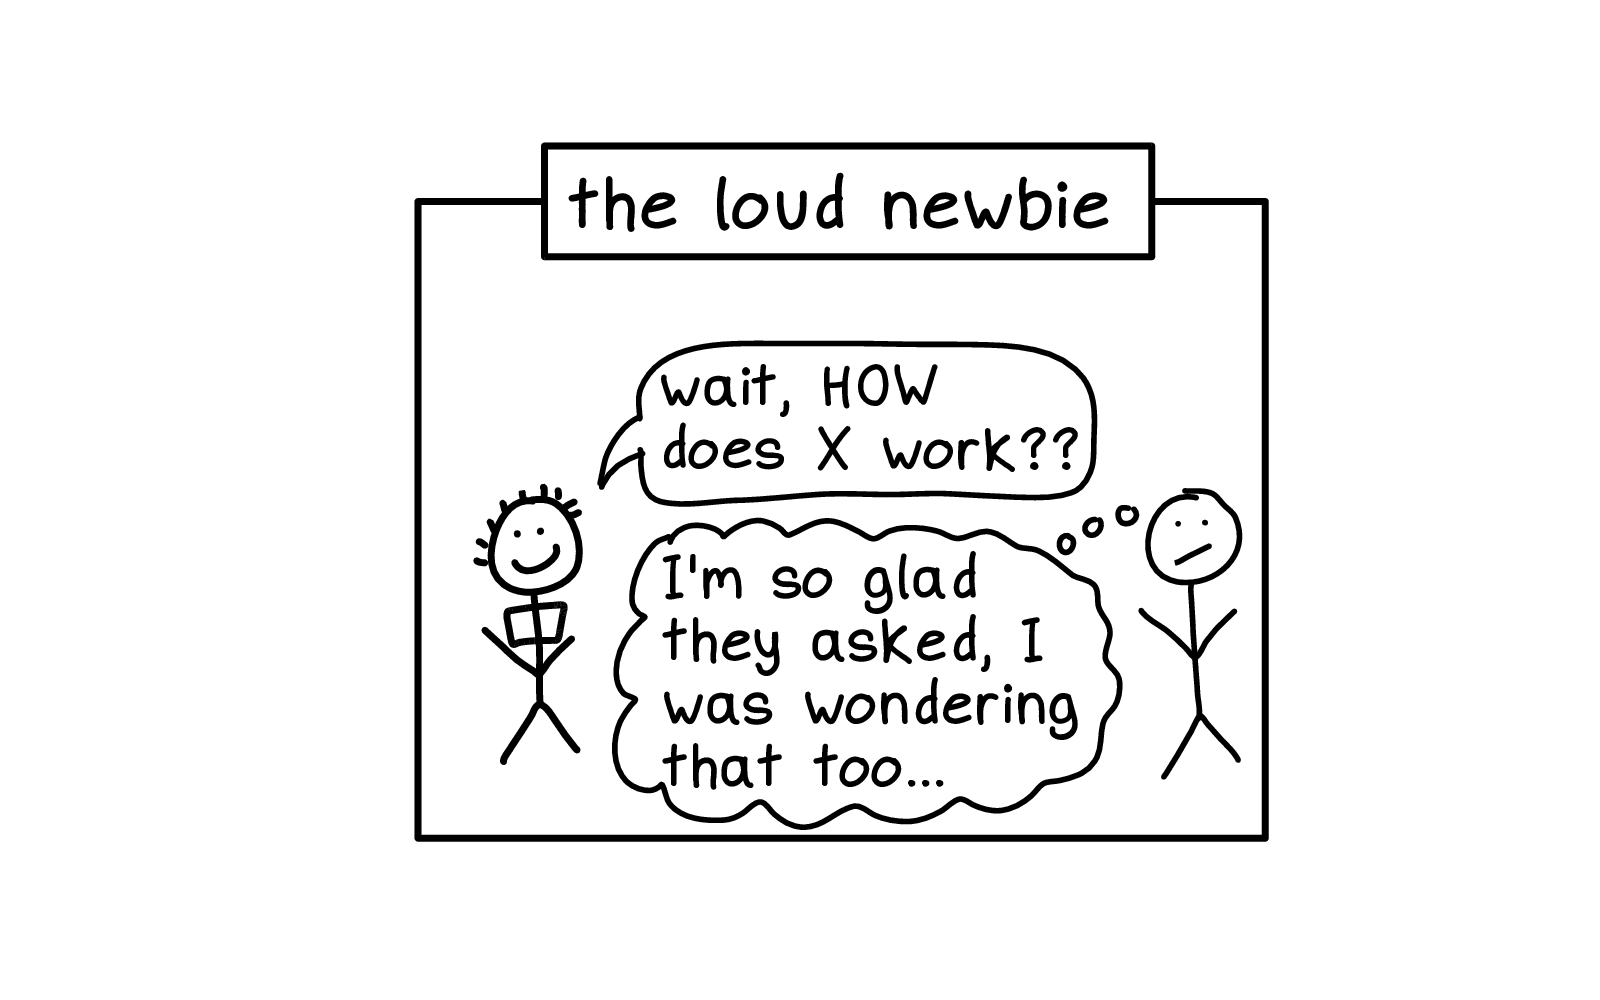
We have the loud newbie, who asks questions like "wait, how does that work?" And then everyone else feels relieved -- "oh, thank god. It's not just me."
I think it's especially valuable when the person who takes the "loud newbie" role is actually a pretty senior developer. Because when you're more secure in your position, it's easier to put yourself out there and say "uh, I don't get this" because nobody is going to judge you for that and think you're incompetent.
And then other people who feel more like they might be judged for not knowing something can ride along on your coattails.
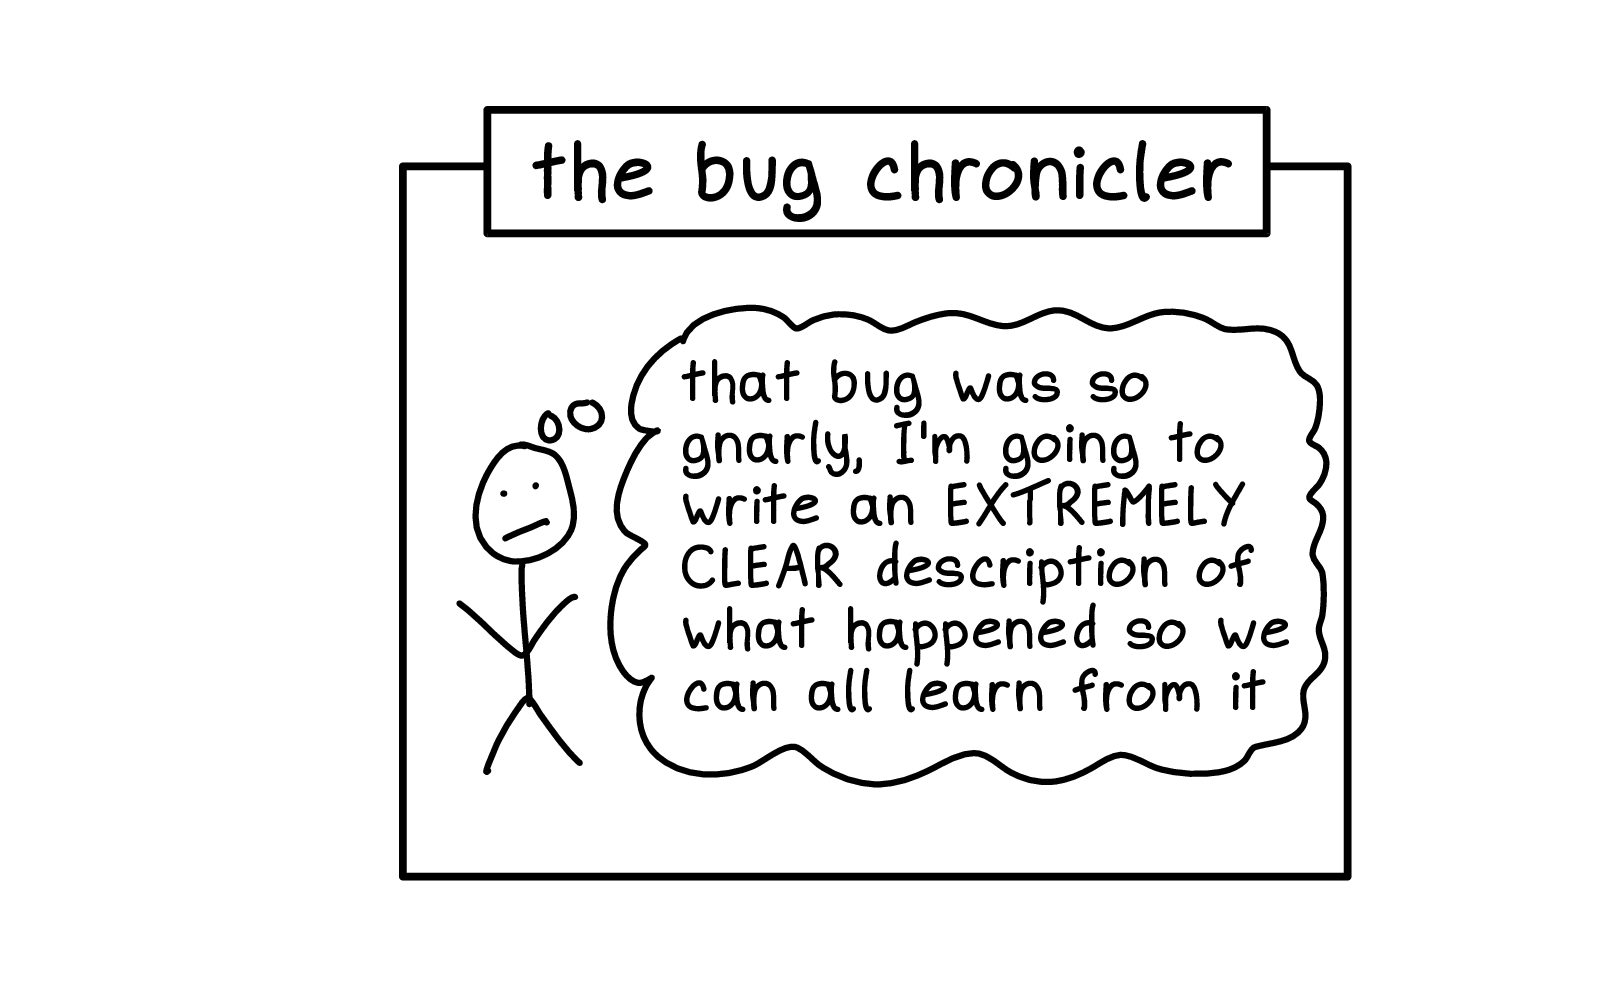
Then we have the bug chronicler. Who decides "ok, that bug. This can never happen again".
"I'm gonna make sure we understand what happened. Because I want this to end now."


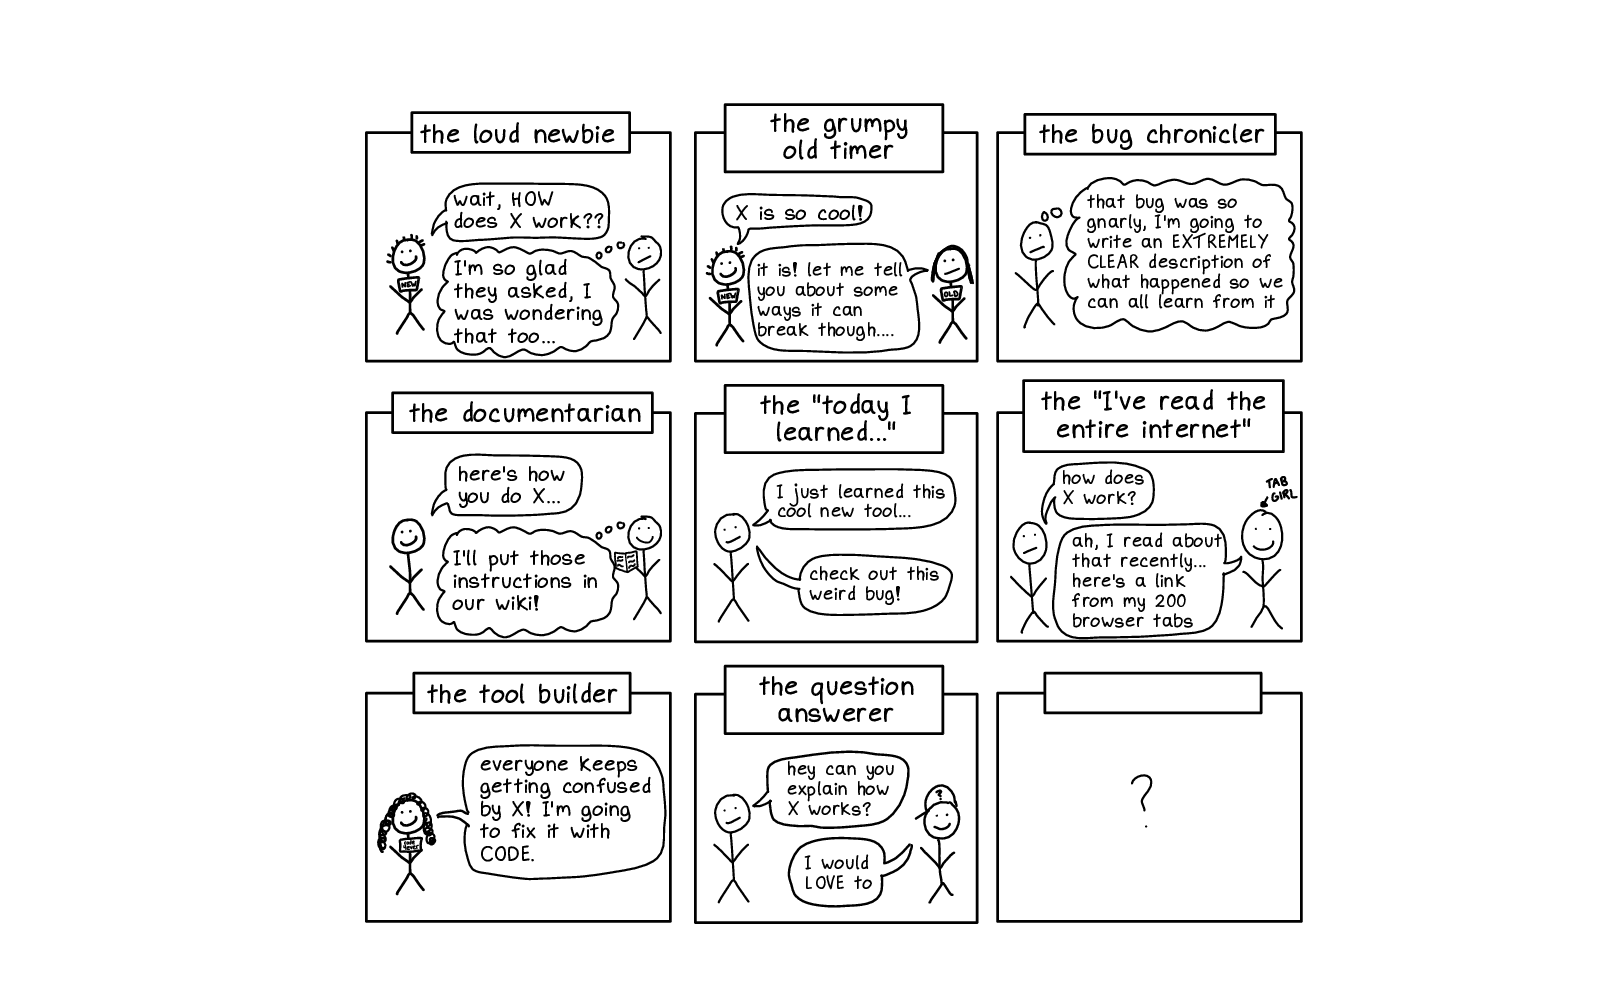


And much like when debugging a computer program, when you have a bug, you want to understand why the bug is happening if you're gonna fix it.
If we're all struggling with the same things together for the same reasons, if we can figure out what those reasons are, we can do a better job of fixing them.
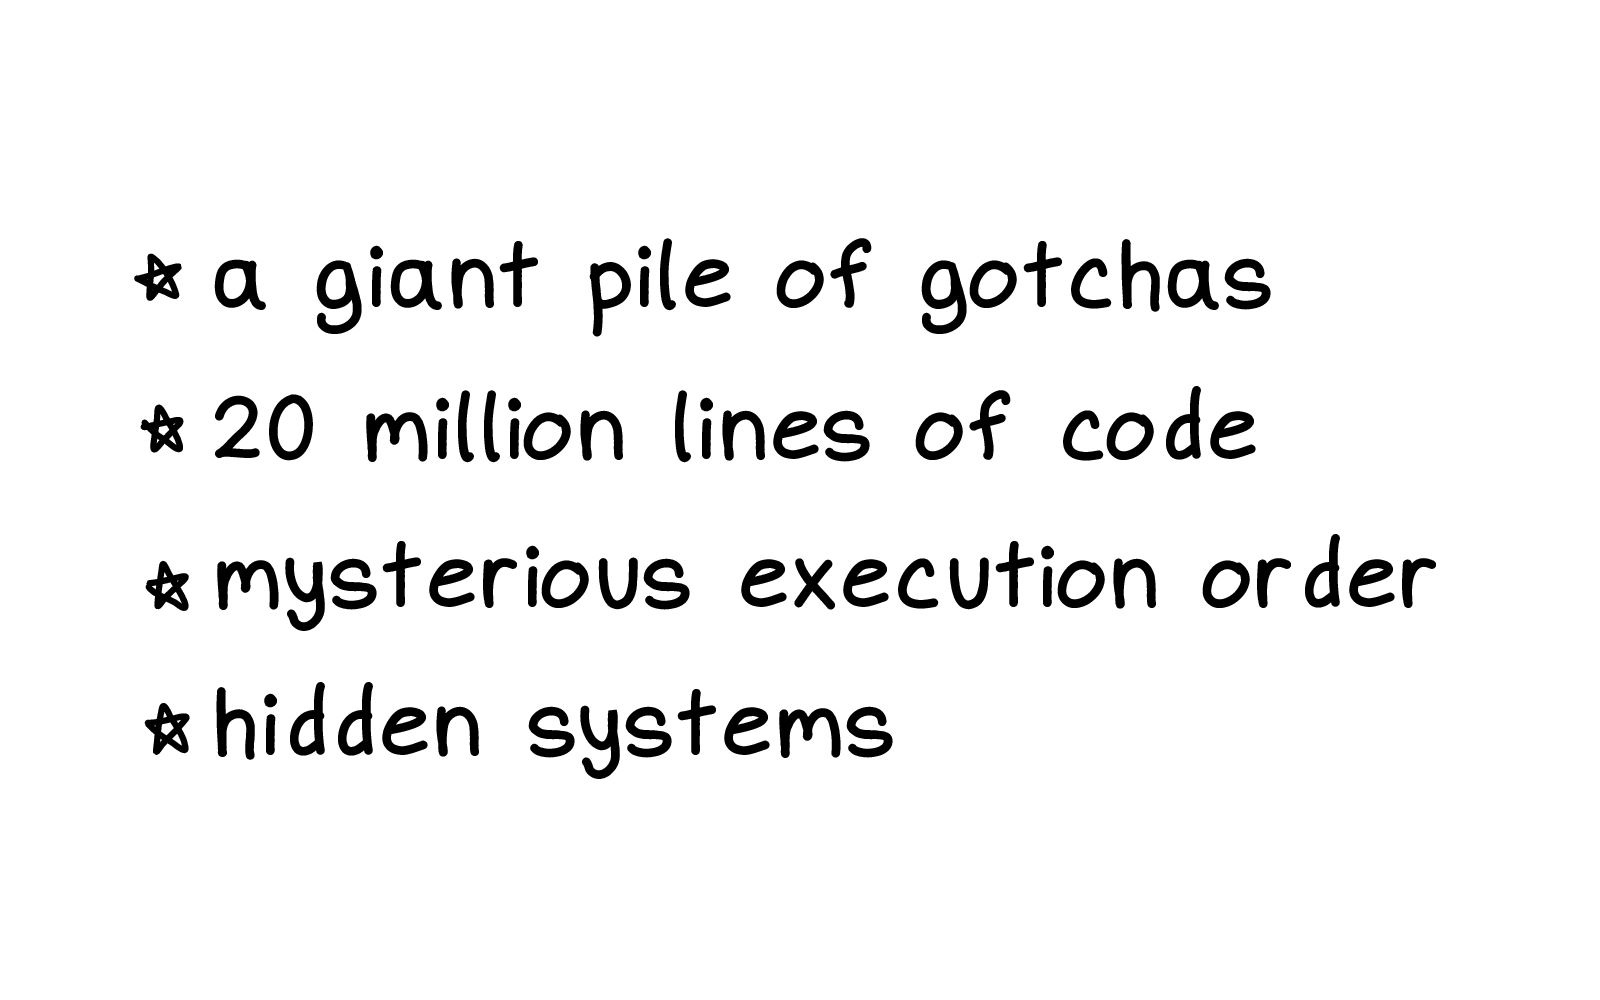
- a giant pile of trivia and gotchas.
- or maybe there's 20 million lines of code somewhere.
- Maybe a big part of the system is being hidden from you.
- Maybe the tool's output is extremely confusing and no UI designer has ever worked on improving it


And that's all I have for you. Thank you.
I brought some zines to the conference, if you come to the signing later on you can get one.
some thanks
This was the last ever Strange Loop and I’m really grateful to Alex Miller and the whole organizing team for making such an incredible conference for so many years. Strange Loop accepted one of my first talks (you can be a kernel hacker) 9 years ago when I had almost no track record as a speaker so I owe a lot to them.
Thanks to Sumana for coming up with the idea for this talk, and to Marie, Danie, Kamal, Alyssa, and Maya for listening to rough drafts of it and helping make it better, and to Dolly, Jesse, and Marco for some of the conversations I mentioned.
Also after the conference Nick Fagerland wrote a nice post with thoughts on why git is hard in response to my “I don’t know why git is hard” comment and I really appreciated it. It had some new-to-me ideas and I’d love to read more analyses like that.
In a git repository, where do your files live?
Hello! I was talking to a friend about how git works today, and we got onto the
topic – where does git store your files? We know that it’s in your .git
directory, but where exactly in there are all the versions of your old files?
For example, this blog is in a git repository, and it contains a file called
content/post/2019-06-28-brag-doc.markdown. Where is that in my .git folder?
And where are the old versions of that file? Let’s investigate by writing some
very short Python programs.
git stores files in .git/objects
Every previous version of every file in your repository is in .git/objects.
For example, for this blog, .git/objects contains 2700 files.
$ find .git/objects/ -type f | wc -l
2761
note: .git/objects actually has more information than “every previous version
of every file in your repository”, but we’re not going to get into that just yet
Here’s a very short Python program
(find-git-object.py) that
finds out where any given file is stored in .git/objects.
import hashlib
import sys


def object_path(content):
    header = f"blob {len(content)}\0"
    data = header.encode() + content
    digest = hashlib.sha1(data).hexdigest()
    return f".git/objects/{digest[:2]}/{digest[2:]}"


with open(sys.argv[1], "rb") as f:
    print(object_path(f.read()))
What this does is:
- read the contents of the file
- calculate a header (
blob 16673\0) and combine it with the contents - calculate the sha1 sum (
e33121a9af82dd99d6d706d037204251d41d54in this case) - translate that sha1 sum into a path (
.git/objects/e3/3121a9af82dd99d6d706d037204251d41d54)
We can run it like this:
$ python3 find-git-object.py content/post/2019-06-28-brag-doc.markdown
.git/objects/8a/e33121a9af82dd99d6d706d037204251d41d54
jargon: “content addressed storage”
The term for this storage strategy (where the filename of an object in the database is the same as the hash of the file’s contents) is “content addressed storage”.
One neat thing about content addressed storage is that if I have two files (or
50 files!) with the exact same contents, that doesn’t take up any extra space
in Git’s database – if the hash of the contents is aabbbbbbbbbbbbbbbbbbbbbbbbb, they’ll both be stored in .git/objects/aa/bbbbbbbbbbbbbbbbbbbbb.
how are those objects encoded?
If I try to look at this file in .git/objects, it gets a bit weird:
$ cat .git/objects/8a/e33121a9af82dd99d6d706d037204251d41d54
x^A<8D><9B>}s<E3>Ƒ<C6><EF>o|<8A>^Q<9D><EC>ju<92><E8><DD>\<9C><9C>*<89>j<FD>^...
What’s going on? Let’s run file on it:
$ file .git/objects/8a/e33121a9af82dd99d6d706d037204251d41d54
.git/objects/8a/e33121a9af82dd99d6d706d037204251d41d54: zlib compressed data
It’s just compressed! We can write another little Python program called decompress.py that uses the zlib module to decompress the data:
import zlib
import sys

with open(sys.argv[1], "rb") as f:
    content = f.read()
    print(zlib.decompress(content).decode())
Now let’s decompress it:
$ python3 decompress.py .git/objects/8a/e33121a9af82dd99d6d706d037204251d41d54
blob 16673---
title: "Get your work recognized: write a brag document"
date: 2019-06-28T18:46:02Z
url: /blog/brag-documents/
categories: []
---
... the entire blog post ...
So this data is encoded in a pretty simple way: there’s this
blob 16673\0 thing, and then the full contents of the file.
there aren’t any diffs
One thing that surprised me here is the first time I learned it: there aren’t
any diffs here! That file is the 9th version of that blog post, but the version
git stores in the .git/objects is the whole file, not the diff from the
previous version.
Git actually sometimes also does store files as diffs (when you run git gc it
can combine multiple different files into a “packfile” for efficiency), but I
have never needed to think about that in my life so we’re not going to get into
it. Aditya Mukerjee has a great post called Unpacking Git packfiles about how the format works.
what about older versions of the blog post?
Now you might be wondering – if there are 8 previous versions of that blog
post (before I fixed some typos), where are they in the .git/objects
directory? How do we find them?
First, let’s find every commit where that file changed with git log:
$ git log --oneline  content/post/2019-06-28-brag-doc.markdown
c6d4db2d
423cd76a
7e91d7d0
f105905a
b6d23643
998a46dd
67a26b04
d9999f17
026c0f52
72442b67
Now let’s pick a previous commit, let’s say 026c0f52. Commits are also stored
in .git/objects, and we can try to look at it there. But the commit isn’t
there! ls .git/objects/02/6c* doesn’t have any results! You know how we
mentioned “sometimes git packs objects to save space but we don’t need to worry
about it?“. I guess now is the time that we need to worry about it.
So let’s take care of that.
let’s unpack some objects
So we need to unpack the objects from the pack files. I looked it up on Stack Overflow and apparently you can do it like this:
$ mv .git/objects/pack/pack-adeb3c14576443e593a3161e7e1b202faba73f54.pack .
$ git unpack-objects < pack-adeb3c14576443e593a3161e7e1b202faba73f54.pack
This is weird repository surgery so it’s a bit alarming but I can always just clone the repository from Github again if I mess it up, so I wasn’t too worried.
After unpacking all the object files, we end up with way more objects: about 20000 instead of about 2700. Neat.
find .git/objects/ -type f | wc -l
20138
back to looking at a commit
Now we can go back to looking at our commit 026c0f52. You know how we said
that not everything in .git/objects is a file? Some of them are commits! And
to figure out where the old version of our post
content/post/2019-06-28-brag-doc.markdown is stored, we need to dig pretty
deep into this commit.
The first step is to look at the commit in .git/objects.
commit step 1: look at the commit
The commit 026c0f52 is now in
.git/objects/02/6c0f5208c5ea10608afc9252c4a56c1ac1d7e4 after doing some
unpacking and we can look at it like this:
$ python3 decompress.py .git/objects/02/6c0f5208c5ea10608afc9252c4a56c1ac1d7e4
commit 211tree 01832a9109ab738dac78ee4e95024c74b9b71c27
parent 72442b67590ae1fcbfe05883a351d822454e3826
author Julia Evans <julia@jvns.ca> 1561998673 -0400
committer Julia Evans <julia@jvns.ca> 1561998673 -0400

brag doc
We can also get same information with git cat-file -p 026c0f52, which does the same thing but does a better job of formatting the data. (the -p option means “format it nicely please”)
commit step 2: look at the tree
This commit has a tree. What’s that? Well let’s take a look. The tree’s ID
is 01832a9109ab738dac78ee4e95024c74b9b71c27, and we can use our
decompress.py script from earlier to look at that git object. (though I had to remove the .decode() to get the script to not crash)
$ python3 decompress.py .git/objects/01/832a9109ab738dac78ee4e95024c74b9b71c27
b'tree 396\x00100644 .gitignore\x00\xc3\xf7`$8\x9b\x8dO\x19/\x18\xb7}|\xc7\xce\x8e:h\xad100644 README.md\x00~\xba\xec\xb3\x11\xa0^\x1c\xa9\xa4?\x1e\xb9\x0f\x1cfG\x96\x0b
This is formatted in kind of an unreadable way. The main display issue here is that
the commit hashes (\xc3\xf7$8\x9b\x8dO\x19/\x18\xb7}|\xc7\xce\…) are raw
bytes instead of being encoded in hexadecimal. So we see \xc3\xf7$8\x9b\x8d
instead of c3f76024389b8d. Let’s switch over to using git cat-file -p which
formats the data in a friendlier way, because I don’t feel like writing a
parser for that.
$ git cat-file -p 01832a9109ab738dac78ee4e95024c74b9b71c27
100644 blob c3f76024389b8d4f192f18b77d7cc7ce8e3a68ad	.gitignore
100644 blob 7ebaecb311a05e1ca9a43f1eb90f1c6647960bc1	README.md
100644 blob 0f21dc9bf1a73afc89634bac586271384e24b2c9	Rakefile
100644 blob 00b9d54abd71119737d33ee5d29d81ebdcea5a37	config.yaml
040000 tree 61ad34108a327a163cdd66fa1a86342dcef4518e	content <-- this is where we're going next
040000 tree 6d8543e9eeba67748ded7b5f88b781016200db6f	layouts
100644 blob 22a321a88157293c81e4ddcfef4844c6c698c26f	mystery.rb
040000 tree 8157dc84a37fca4cb13e1257f37a7dd35cfe391e	scripts
040000 tree 84fe9c4cb9cef83e78e90a7fbf33a9a799d7be60	static
040000 tree 34fd3aa2625ba784bced4a95db6154806ae1d9ee	themes
This is showing us all of the files I had in the root directory of the
repository as of that commit. Looks like I accidentally committed some file
called mystery.rb at some point which I later removed.
Our file is in the content directory, so let’s look at that tree: 61ad34108a327a163cdd66fa1a86342dcef4518e
commit step 3: yet another tree
$ git cat-file -p 61ad34108a327a163cdd66fa1a86342dcef4518e

040000 tree 1168078878f9d500ea4e7462a9cd29cbdf4f9a56	about
100644 blob e06d03f28d58982a5b8282a61c4d3cd5ca793005	newsletter.markdown
040000 tree 1f94b8103ca9b6714614614ed79254feb1d9676c	post <-- where we're going next!
100644 blob 2d7d22581e64ef9077455d834d18c209a8f05302	profiler-project.markdown
040000 tree 06bd3cee1ed46cf403d9d5a201232af5697527bb	projects
040000 tree 65e9357973f0cc60bedaa511489a9c2eeab73c29	talks
040000 tree 8a9d561d536b955209def58f5255fc7fe9523efd	zines
Still not done…
commit step 4: one more tree….
The file we’re looking for is in the post/ directory, so there’s one more tree:
$ git cat-file -p 1f94b8103ca9b6714614614ed79254feb1d9676c
.... MANY MANY lines omitted ...
100644 blob 170da7b0e607c4fd6fb4e921d76307397ab89c1e	2019-02-17-organizing-this-blog-into-categories.markdown
100644 blob 7d4f27e9804e3dc80ab3a3912b4f1c890c4d2432	2019-03-15-new-zine--bite-size-networking-.markdown
100644 blob 0d1b9fbc7896e47da6166e9386347f9ff58856aa	2019-03-26-what-are-monoidal-categories.markdown
100644 blob d6949755c3dadbc6fcbdd20cc0d919809d754e56	2019-06-23-a-few-debugging-resources.markdown
100644 blob 3105bdd067f7db16436d2ea85463755c8a772046	2019-06-28-brag-doc.markdown <-- found it!!!!!
Here the 2019-06-28-brag-doc.markdown is the last file listed because it was
the most recent blog post when it was published.
commit step 5: we made it!
Finally we have found the object file where a previous version of my blog post
lives! Hooray! It has the hash 3105bdd067f7db16436d2ea85463755c8a772046, so
it’s in git/objects/31/05bdd067f7db16436d2ea85463755c8a772046.
We can look at it with decompress.py
$ python3 decompress.py .git/objects/31/05bdd067f7db16436d2ea85463755c8a772046 | head
blob 15924---
title: "Get your work recognized: write a brag document"
date: 2019-06-28T18:46:02Z
url: /blog/brag-documents/
categories: []
---
... rest of the contents of the file here ...
This is the old version of the post! If I ran git checkout 026c0f52 content/post/2019-06-28-brag-doc.markdown or git restore --source 026c0f52 content/post/2019-06-28-brag-doc.markdown, that’s what I’d get.
this tree traversal is how git log works
This whole process we just went through (find the commit, go through the
various directory trees, search for the filename we wanted) seems kind of long
and complicated but this is actually what’s happening behind the scenes when we
run git log content/post/2019-06-28-brag-doc.markdown. It needs to go through
every single commit in your history, check the version (for example
3105bdd067f7db16436d2ea85463755c8a772046 in this case) of
content/post/2019-06-28-brag-doc.markdown, and see if it changed from the previous commit.
That’s why git log FILENAME is a little slow sometimes – I have 3000 commits in this
repository and it needs to do a bunch of work for every single commit to figure
out if the file changed in that commit or not.
how many previous versions of files do I have?
Right now I have 1530 files tracked in my blog repository:
$ git ls-files | wc -l
1530
But how many historical files are there? We can list everything in .git/objects to see how many object files there are:
$ find .git/objects/ -type f | grep -v pack | awk -F/ '{print $3 $4}' | wc -l
20135
Not all of these represent previous versions of files though – as we saw
before, lots of them are commits and directory trees. But we can write another little Python
script called find-blobs.py that goes through all of the objects and checks
if it starts with blob or not:
import zlib
import sys

for line in sys.stdin:
    line = line.strip()
    filename = f".git/objects/{line[0:2]}/{line[2:]}"
    with open(filename, "rb") as f:
        contents = zlib.decompress(f.read())
        if contents.startswith(b"blob"):
            print(line)
$ find .git/objects/ -type f | grep -v pack | awk -F/ '{print $3 $4}' | python3 find-blobs.py | wc -l
6713
So it looks like there are 6713 - 1530 = 5183 old versions of files lying
around in my git repository that git is keeping around for me in case I ever
want to get them back. How nice!
that’s all!
Here’s the gist with all the code for this post. There’s not very much.
I thought I already knew how git worked, but I’d never really thought about
pack files before so this was a fun exploration. I also don’t spend too much
time thinking about how much work git log is actually doing when I ask it to
track the history of a file, so that was fun to dig into.
As a funny postscript: as soon as I committed this blog post, git got mad about
how many objects I had in my repository (I guess 20,000 is too many!) and
ran git gc to compress them all into packfiles. So now my .git/objects
directory is very small:
$ find .git/objects/ -type f | wc -l
14
Notes on using a single-person Mastodon server
I started using Mastodon back in November, and it’s the Twitter alternative where I’ve been spending most of my time recently, mostly because the Fediverse is where a lot of the Linux nerds seem to be right now.
I’ve found Mastodon quite a bit more confusing than Twitter because it’s a distributed system, so here are a few technical things I’ve learned about it over the last 10 months. I’ll mostly talk about what using a single-person server has been like for me, as well as a couple of notes about the API, DMs and ActivityPub.
I might have made some mistakes, please let me know if I’ve gotten anything wrong!
what’s a mastodon instance?
First: Mastodon is a decentralized collection of independently run servers instead of One Big Server. The software is open source.
In general, if you have an account on one server (like ruby.social), you
can follow people on another server (like hachyderm.io), and they can
follow you.
I’m going to use the terms “Mastodon server” and “Mastodon instance” interchangeably in this post.
on choosing a Mastodon instance
These were the things I was concerned about when choosing an instance:
- An instance name that I was comfortable being part of my online
identity. For example, I probably wouldn’t want to be
@b0rk@infosec.exchangebecause I’m not an infosec person. - The server’s stability. Most servers are volunteer-run, and volunteer moderation work can be exhausting – will the server really be around in a few years? For example mastodon.technology and mastodon.lol shut down.
- The admins’ moderation policies.
- That server’s general reputation with other servers. I started out on
mastodon.social, but some servers choose to block or limit mastodon.social for various reasons - The community: every Mastodon instance has a local timeline with all posts from users on that instance, would I be interested in reading the local timeline?
- Whether my account would be a burden for the admin of that server (since I have a lot of followers)
In the end, I chose to run my own mastodon server because it seemed simplest – I could pick a domain I liked, and I knew I’d definitely agree with the moderation decisions because I’d be in charge.
I’m not going to give server recommendations here, but here’s a list of the top 200 most common servers people who follow me use.
using your own domain
One big thing I wondered was – can I use my own domain (and have the username @b0rk@jvns.ca or something) but be on someone else’s Mastodon server?
The answer to this seems to be basically “no”: if you want to use your own
domain on Mastodon, you need to run your own server. (you can kind of do this,
but it’s more like an alias or redirect – if I used that method to direct b0rk@jvns.ca to b0rk@mastodon.social, my
posts would still show up as being from b0rk@mastodon.social)
There’s also other ActivityPub software (Takahē) that supports people bringing their own domain in a first-class way.
notes on having my own server
I really wanted to have a way to use my own domain name for identity, but to share server hosting costs with other people. This isn’t possible on Mastodon right now, so I decided to set up my own server instead.
I chose to run a Mastodon server (instead of some other ActivityPub implementation) because Mastodon is the most popular one. Good managed Mastodon hosting is readily available, there are tons of options for client apps, and I know for sure that my server will work well with other people’s servers.
I use masto.host for Mastodon hosting, and it’s been great so far. I have nothing interesting to say about what it’s like to operate a Mastodon instance because I know literally nothing about it. Masto.host handles all of the server administration and Mastodon updates, and I never think about it at all.
Right now I’m on their $19/month (“Star”) plan, but it’s possible I could use a smaller plan with no problems. Right now their cheapest plan is $6/month and I expect that would be fine for someone with a smaller account.
Some things I was worried about when embarking on my own Mastodon server:
- I wanted to run the server at
social.jvns.ca, but I wanted my username to beb0rk@jvns.cainstead ofb0rk@social.jvns.ca. To get this to work I followed these Setting up a personal fediverse ID directions from Jacob Kaplan-Moss and it’s been fine. - The administration burden of running my own server. I imported a small list of servers to block/defederate from but didn’t do anything else. That’s been fine.
- Reply and profile visibility. This has been annoying and we’ll talk about it next
downsides to being on a single-person server
Being on a 1-person server has some significant downsides. To understand why, you need to understand a little about how Mastodon works.
Every Mastodon server has a database of posts. Servers only have posts that they were explicitly sent by another server in their database.
Some reasons that servers might receive posts:
- someone on the server follows a user
- a post mentions someone on the server
As a 1-person server, my server does not receive that many posts! I only get posts from people I follow or posts that explicitly mention me in some way.
The causes several problems:
- when I visit someone’s profile on Mastodon who I don’t already follow, my server will not fetch the profile’s content (it’ll fetch their profile picture, description, and pinned posts, but not any of their post history). So their profile appears as if they’ve never posted anything
- bad reply visibility: when I look at the replies to somebody else’s post (even if I follow them!), I don’t see all of the replies, only the ones which have made it to my server. If you want to understand the exact rules about who can see which replies (which are quite complicated!), here’s a great deep dive by Sebastian Jambor. I think it’s possible to end up in a state where no one person can see all of the replies, including the original poster.
- favourite and boost accounts are inaccurate – usually posts show up having at most 1 or 2 favourites / boosts, even if the post was actually favourite or boosted hundreds of times. I think this is because it only counts favourites/boosts from people I follow.
All of these things will happen to users of any small Mastodon server, not just 1-person servers.
bad reply visibility makes conversations harder
A lot of people are on smaller servers, so when they’re participating in a conversation, they can’t see all the replies to the post.
This means that replies can get pretty repetitive because people literally cannot see each other’s replies. This is especially annoying for posts that are popular or controversial, because the person who made the post has to keep reading similar replies over and over again by people who think they’re making the point for the first time.
To get around this (as a reader), you can click “open link to post” or something in your Mastodon client, which will open up the page on the poster’s server where you can read all of the replies. It’s pretty annoying though.
As a poster, I’ve tried to reduce repetitiveness in replies by:
- putting requests in my posts like “(no need to reply if you don’t remember, or if you’ve been using the command line comfortably for 15 years — this question isn’t for you :) )”
- occasionally editing my posts to include very common replies
- very occasionally deleting the post if it gets too out of hand
The Mastodon devs are extremely aware of these issues, there are a bunch of github issues about them:
My guess is that there are technical reasons these features are difficult to add because those issues have been open for 5-7 years.
The Mastodon devs have said that they plan to improve reply fetching, but that it requires a significant amount of work.
some visibility workarounds
Some people have built workarounds for fetching profiles / replies.
Also, there are a couple of Mastodon clients which will proactively fetch replies. For iOS:
- Mammoth does it automatically
- Mona will fetch posts if I click “load from remote server” manually
I haven’t tried those yet though.
other downsides of running your own server: discovery is much harder
Mastodon instances have a “local timeline” where you can see everything other people on the server are posting, and a “federated timeline” which shows sort of a combined feed from everyone followed by anyone on the server. This means that you can see trending posts and get an idea of what’s going on and find people to follow. You don’t get that if you’re on a 1-person server – it’s just me talking to myself! (plus occasional interjections from my reruns bot).
Some workarounds people mentioned for this:
- you can populate your federated timeline with posts from another instance by using a relay. I haven’t done this but someone else said they use FediBuzz and I might try it out.
- some mastodon clients (like apparently Moshidon on Android) let you follow other instances
If anyone else on small servers has suggestions for how to make discovery easier I’d love to hear them.
account migration
When I moved to my own server from mastodon.social, I needed to run an account migration to move over my followers. First, here’s how migration works:
- Account migration does not move over your posts. All of my posts stayed on my old account. This is part of why I moved to running my own server – I didn’t want to ever lose my posts a second time.
- Account migration does not move over the list of people you follow/mute/block. But you can import/export that list in your Mastodon settings so it’s not a big deal. If you follow private accounts they’ll have to re-approve your follow request.
- Account migration does move over your followers
The follower move was the part I was most worried about. Here’s how it turned out:
- over ~24 hours, most of my followers moved to the new account
- one or two servers did not get the message about the account migration for some reason, so about 2000 followers were “stuck” and didn’t migrate. I fixed this by waiting 30 days and re-running the account migration, which moved over most of the remaining followers. There’s also a tootctl command that the admin of the old instance can run to retry the migration
- about 200 of my followers never migrated over, I think because they’re using ActivityPub software other than Mastodon which doesn’t support account migration. You can see the old account here
using the Mastodon API is great
One thing I love about Mastodon is – it has an API that’s MUCH easier to use than Twitter’s API. I’ve always been frustrated with how difficult it is to navigate large Twitter threads, so I made a small mastodon thread view website that lets you log into your Mastodon account. It’s pretty janky and it’s really only made for me to use, but I’ve really appreciated the ability to write my own janky software to improve my Mastodon experience.
Some notes on the Mastodon API:
- You can build Mastodon client software totally on the frontend in Javascript, which is really cool.
- I couldn’t find a vanilla Javascript Mastodon client, so I wrote a crappy one
- API docs are here
- Here’s a tiny Python script I used to list all my Mastodon followers, which also serves as a simple example of how easy using the API is.
- The best documentation I could find for which OAuth scopes correspond to which API endpoints is this github issue
Next I’ll talk about a few general things about Mastodon that confused or surprised me that aren’t specific to being on a single-person instance.
DMs are weird
The way Mastodon DMs work surprised me in a few ways:
- Technically DMs are just regular posts with visibility limited to the people mentioned in the post. This means that if you accidentally mention someone in a DM (“@x is such a jerk”), it’s possible to accidentally send the message to them
- DMs aren’t very private: the admins on the sending and receiving servers can technically read your DMs if they have access to the database. So they’re not appropriate for sensitive information.
- Turning off DMs is weird. Personally I don’t like receiving DMs from strangers – it’s too much to keep track of and I’d prefer that people email me. On Twitter, I can just turn it off and people won’t see an option to DM me. But on Mastodon, when I turn off notifications for DMs, anyone can still “DM” me, but the message will go into a black hole and I’ll never see it. I put a note in my profile about this.
defederation and limiting
There are a couple of different ways for a server to block another Mastodon server. I haven’t really had to do this much but people talk about it a lot and I was confused about the difference, so:
- A server can defederate from another server (this seems to be called suspend in the Mastodon docs). This means that nobody on a server can follow someone from the other server.
- A server can limit (also known as “silence”) a user or server. This means that content from that user is only visible to that user’s followers – people can’t discover the user through retweets (aka “boosts” on Mastodon).
One thing that wasn’t obvious to me is that who servers defederate / limit is sometimes hidden, so it’s hard to suss out what’s going on if you’re considering joining a server, or trying to understand why you can’t see certain posts.
there’s no search for posts
There’s no way to search past posts you’ve read. If I see something interesting on my timeline and want to find it later, I usually can’t. (Mastodon has a Elasticsearch-based search feature, but it only allows you to search your own posts, your mentions, your favourites, and your bookmarks)
These limitations on search are intentional (and a very common source of arguments) – it’s a privacy / safety issue. Here’s a summary from Tim Bray with lots of links.
It would be personally convenient for me to be able to search more easily but I respect folks’ safety concerns so I’ll leave it at that.
My understanding is that the Mastodon devs are planning to add opt-in search for public posts relatively soon.
other ActivityPub software
We’ve been talking about Mastodon a lot, but not everyone who I follow is using Mastodon: Mastodon uses a protocol called ActivityPub to distribute messages.
Here are some examples of other software I see people talking about, in no particular order:
- Calckey
- Akkoma
- gotosocial
- Takahē
- writefreely
- pixelfed (for images)
I’m probably missing a bunch of important ones.
what’s the difference between Mastodon and other ActivityPub software?
This confused me for a while, and I’m still not super clear on how ActivityPub works. What I’ve understood is:
- ActivityPub is a protocol (you can explore how it works with blinry’s nice JSON explorer)
- Mastodon servers communicate with each other (and with other ActivityPub servers) using ActivityPub
- Mastodon clients communicate with their server using the Mastodon API, which is its own thing
- There’s also software like GoToSocial that aims to be compatible with the Mastodon API, so that you can use a Mastodon client with it
more mastodon resources
- Fedi.Tips seems to be a great introduction
- I think you can still use FediFinder to find folks you followed on Twitter on Mastodon
- I’ve been using the Ivory client on iOS, but there are lots of great clients. Elk is an alternative web client that folks seem to like.
I haven’t written here about what Mastodon culture is like because other people have done a much better job of talking about it than me, but of course it’s is the biggest thing that affects your experience and it was the thing that took me longest to get a handle on. A few links:
- Erin Kissane on frictions people run into when joining Mastodon
- Kyle Kingsbury wrote some great moderation guidelines for woof.group (note: woof.group is a LGBTQ+ leather instance, be prepared to see lots of NSFW posts if you visit it)
- Mekka Okereke writes lots of great posts about issues Black people encounter on Mastodon (though they’re all on Mastodon so it’s a little hard to navigate)
that’s all!
I don’t regret setting up a single-user server – even though it’s inconvenient, it’s important to me to have control over my social media. I think “have control over my social media” is more important to me than it is to most other people though, because I use Twitter/Mastodon a lot for work.
I am happy that I didn’t start out on a single-user server though – I think it would have made getting started on Mastodon a lot more difficult.
Mastodon is pretty rough around the edges sometimes but I’m able to have more interesting conversations about computers there than I am on Twitter (or Bluesky), so that’s where I’m staying for now.